Table of Contents
Three Forex Chart Patterns To Improve Trading
Technical analysis cover many different aspects of trading, from candlestick formations, chart patterns, support and resistance, fibonacci levels and so on. As a well rounded trader, you need to be able to combine them all in your analysis and come up with a strategy or system to conquer the market.
I have a few forex chart patterns which I frequently use for my own trading. They are namely triangles, channels and wedges. Patterns fall into two categories: reversal & continuation patterns. The tricky part about trading is that it’s based on probabilities, not certainty. Therefore a continuation pattern may very well reverse on you ?
So, note that it’s not about memorizing that if this pattern forms it will do such and such (trading blindly by the book), but rather it’s about understanding and knowing where they are in the context of the bigger picture.
This is not a forex for dummies course, I’m not gonna give you illustrations like this, but rather give you real chart examples instead, cause it doesn’t always look like the ones in the pictures, it’s not a perfect and linear environment.
The Complete Price Action Course (Not Forex Trading For Dummies)
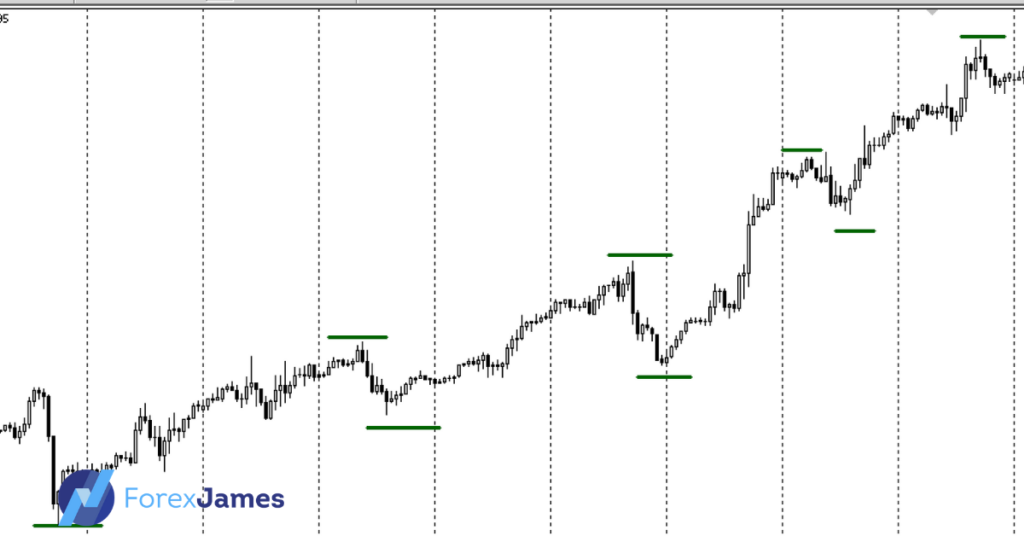
Before we jump into each specific chart patterns, let’s go back to the basics of reading price structures, higher highs, higher lows, lower highs, lower lows. These are trending times with nice easy moves that you can capitalize on. The first signal that a range is about to form is when an uptrend fails to make a new high, or when a downtrend fails to make a new low, hence the range forms, before another trend is born.
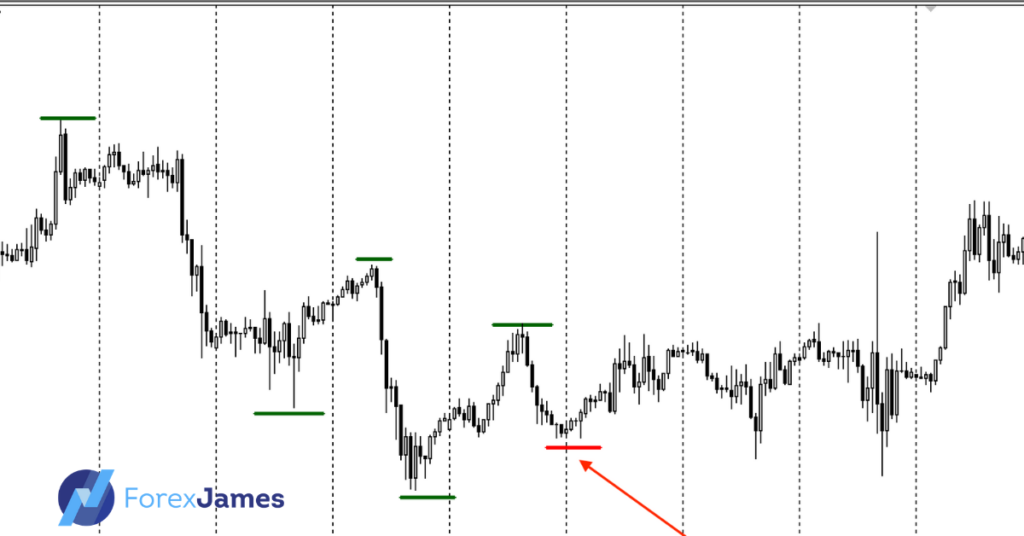
Why do prices range and chart patterns in forex form? Uncertainty, waiting for news releases, profit taking etc. Knowing the current market phase we’re in helps to set our EXPECTATIONS of where it’s GOING TO GO. Newbie traders are often taught to take trades that have a high reward to risk ratio, typically a 3R and therefore they would arbitrarily set their TPs at 3:1. This will not work as you’d need to know where you are in the market phase. It would be easier for someone to bank in a 3R trade in a trending vs a ranging environment.
The patterns I’m about to show you work in both ranging and trending markets and with that being said let’s jump into them.
Triangles:
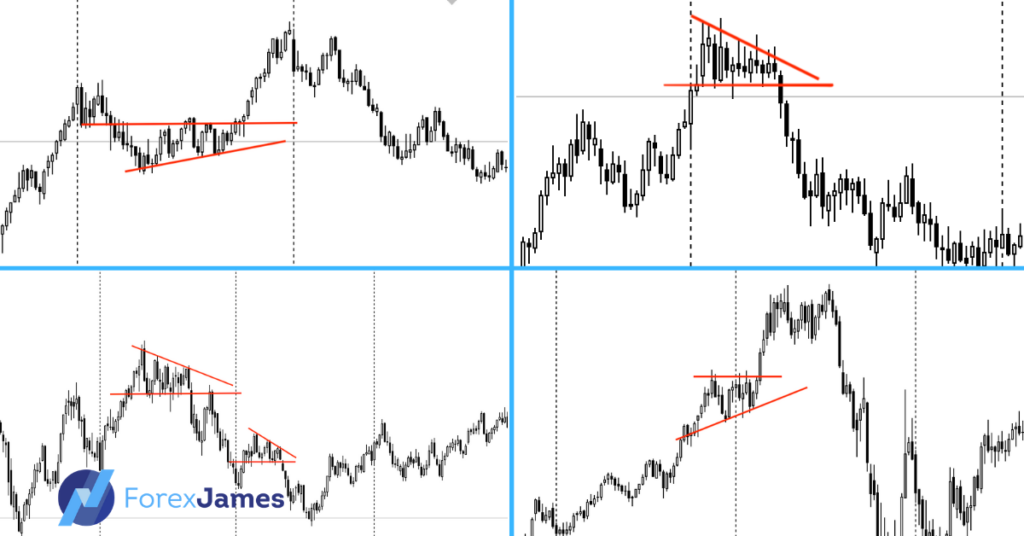
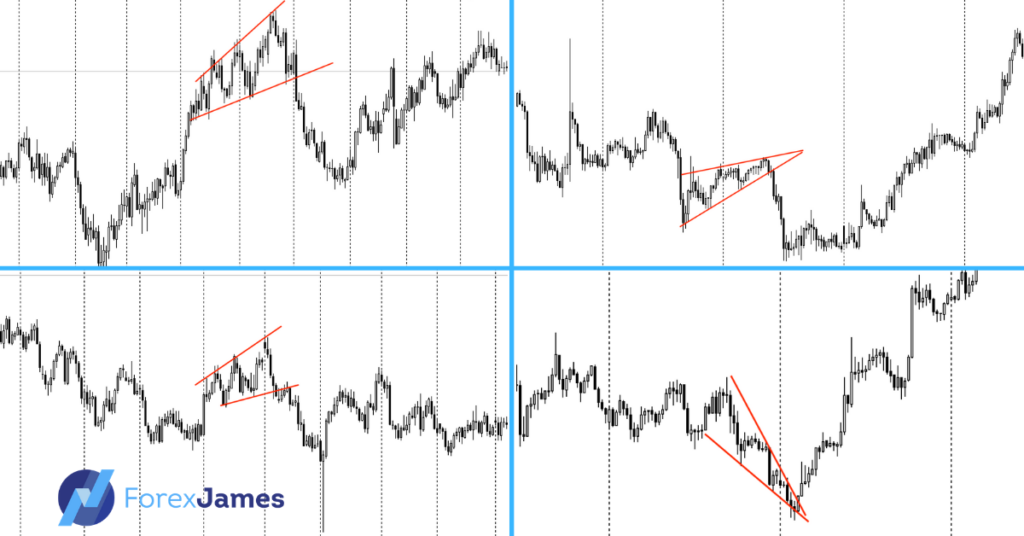
The ascending or descending triangle. Typically ascending triangles break to the upside and descending triangles break to the downside. This the clue of direction triangles can provide us with. Watch me trade a triangle pattern in the video below:
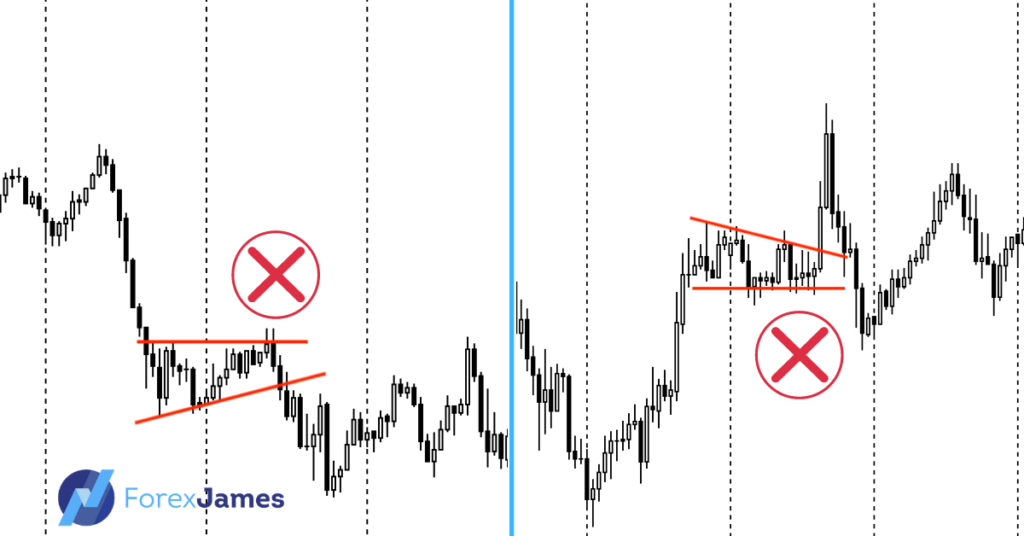
The longer it is horizontally, the lesser the chance or the less powerful breakout it is to the intended side. Here are some examples of triangles that do work as intended and others that failed.
A general rule of thumb is that the smaller/quicker the triangle forms the stronger the move you can expect.
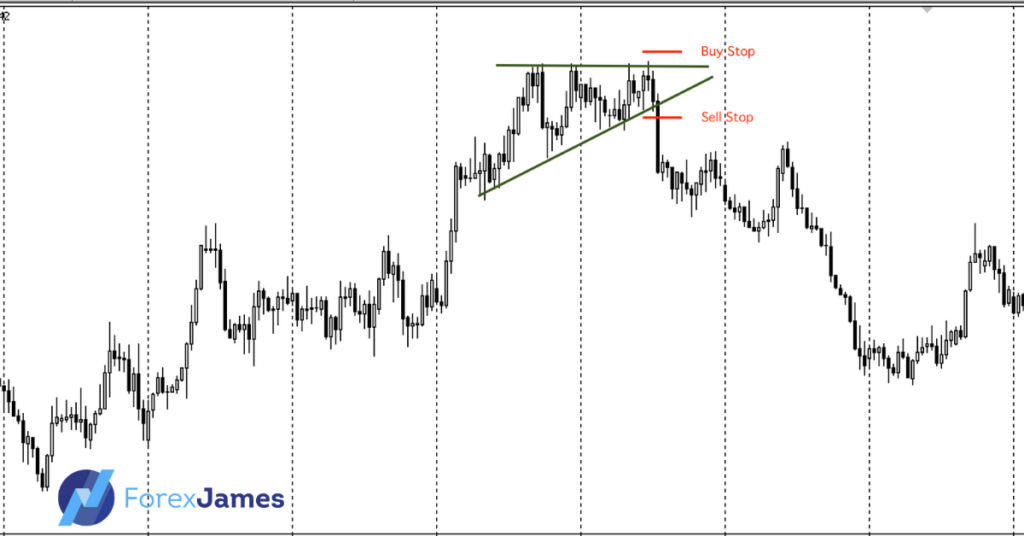
Strategy For Triangles: Breakout
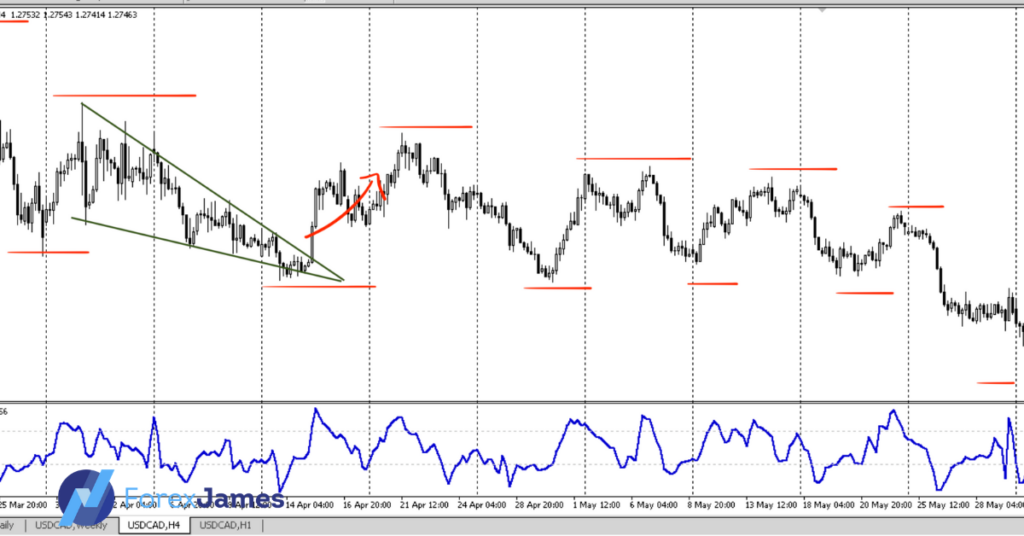
I rarely trade inside a triangle, unless it’s a big one from the higher time frames, which will then be trade-able on the H1. Other times when they are small, it’s best to just take breakouts from either direction. There will be times when an ascending triangle breaks to the downside instead of to the upside, and I’d be happy to participate in them. Sometimes we just need price to tell us what to do and simply follow along. Trading breakouts is pretty straight forward, you just have to place your stop orders on both sides and see which one gets filled first.
Where To Take Profits?
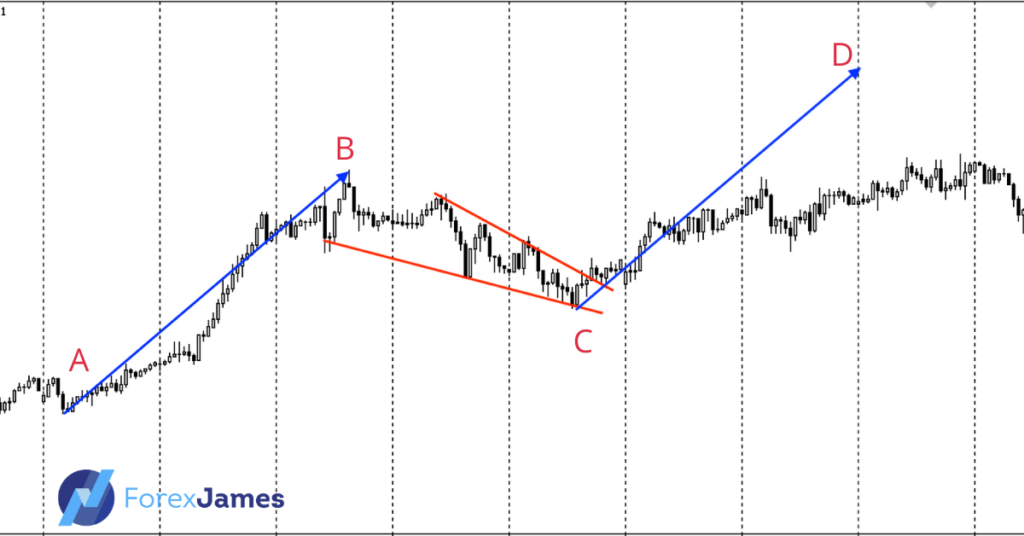
The rule of thumb is the AB = CD pattern. You can measure its initial move as AB and expect an extension just as long. In this picture used as an example below, price failed to reach the targeted price. Other methods include using the fibonacci extensions to measure the length of the projected price.
Learn More About Forex Chart Patterns Here In The Complete Price Action Course.
Wedges:
Technically, this is a reversal pattern, be it the broadening or the narrowing wedge.
In the context of a corrective wave (which is a retracement or a pullback wave) this can be a fairly accurate tool. If you’re trading is as a reversal of the main wave, it’s riskier, cause then you’re trading against the impulsive wave. It’s okay to do it, but just be more prudent in taking profits.
Strategy For Wedges: Breakout
Trading breakouts off these wedge patterns are a fairly safe strategy. We wait for price to break the trendline and enter a few pips above or below it. I cover these patterns in depth in The Complete Price Action Course here.
Where To Take Profits?
The same AB=CD pattern method mentioned above. We measure the initial move and use it as a projection of the move.
Diagonal Ranges
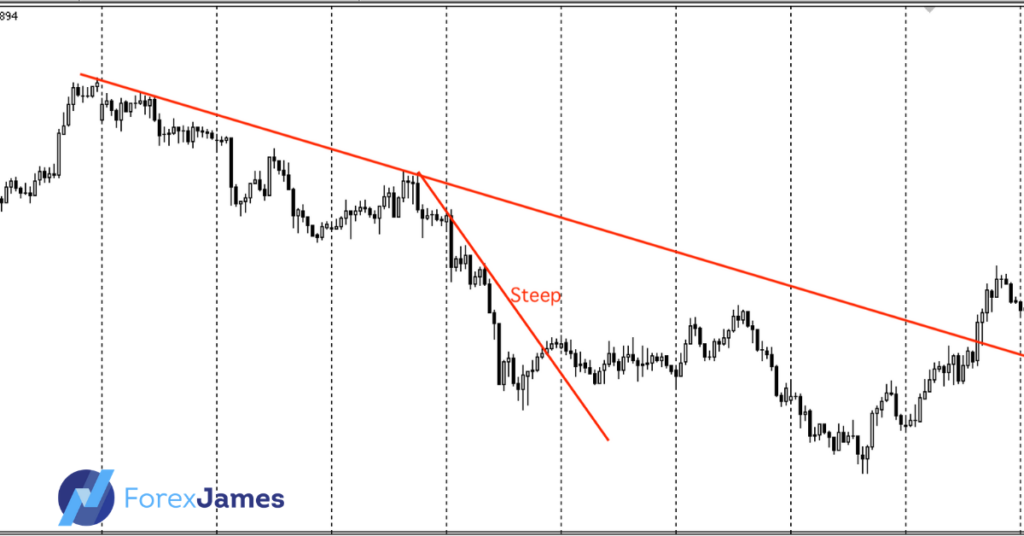
I assume everybody knows how to draw a trendline line here, both to the up or downside. You simply connect two points on a chart and extend it. A trendline tells us not only the direction but also the intensity of the move. We look at the steepness and the angle of the line to tell us how long it’ll stay that way.
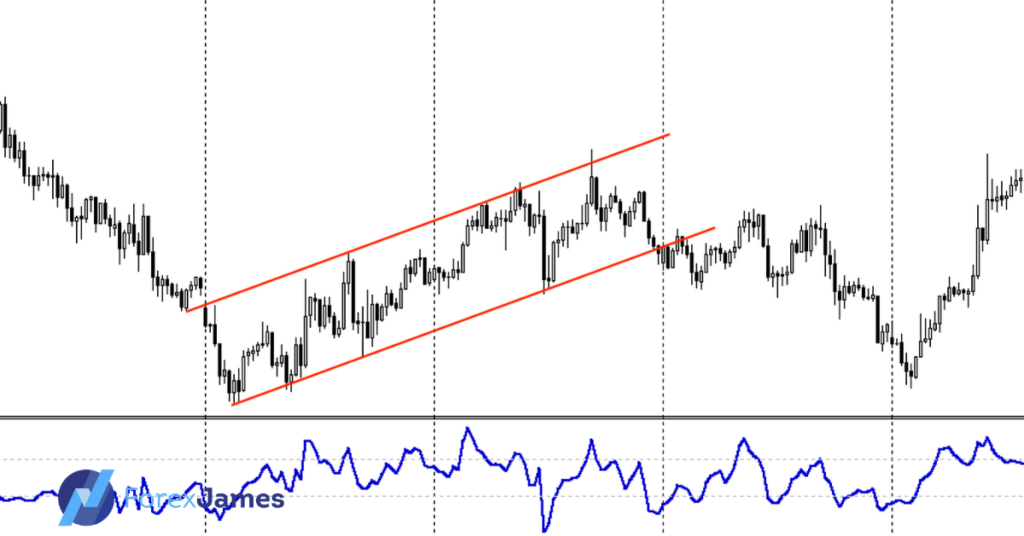
Up Channel ↑
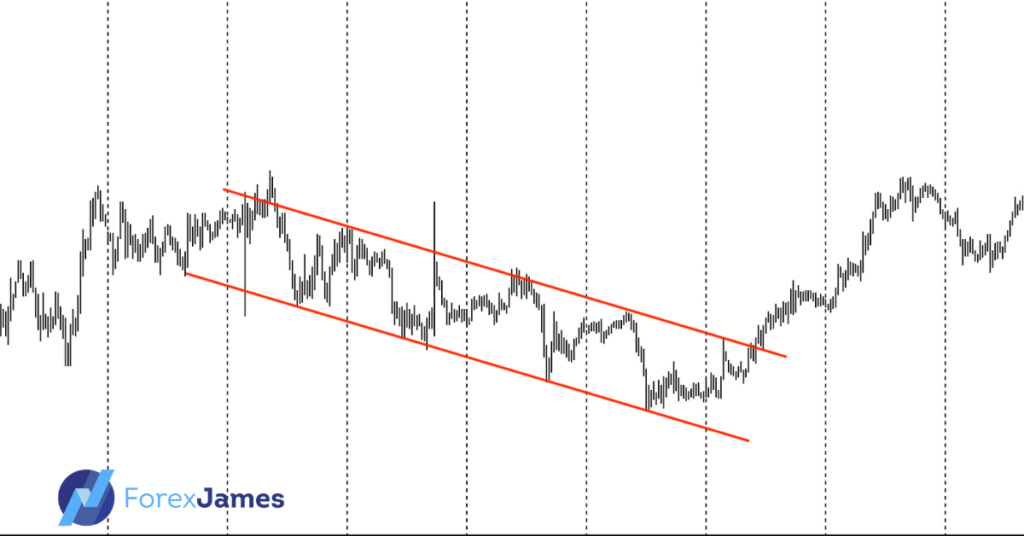
Down Channel ↑
A move that’s too steep will eventually make a pullback. Ideally a trend on a 45 degree angle can sustain for a long time. We may assume that each time price returns to the level, it will bounce back.
Strategy For Diagonal Ranges: Bounces
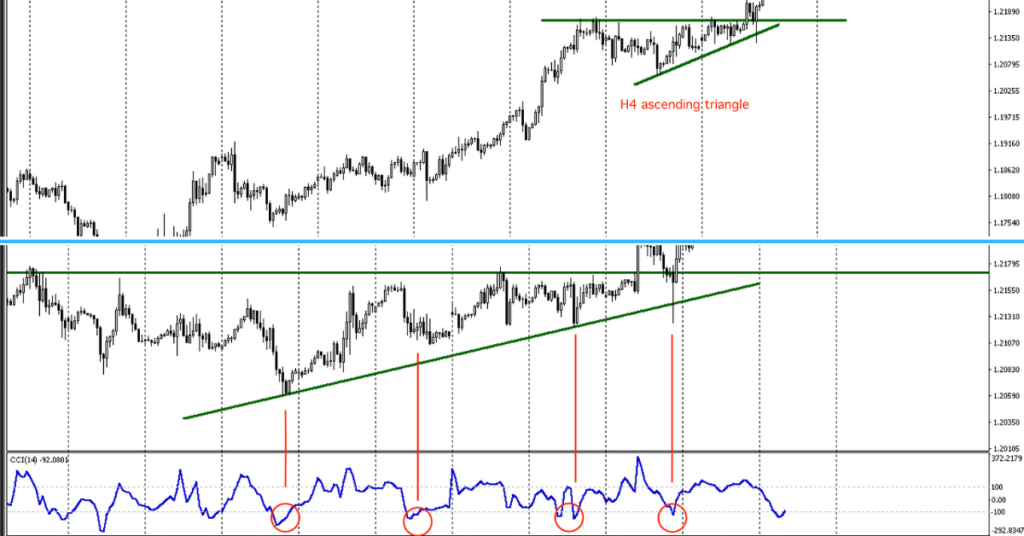
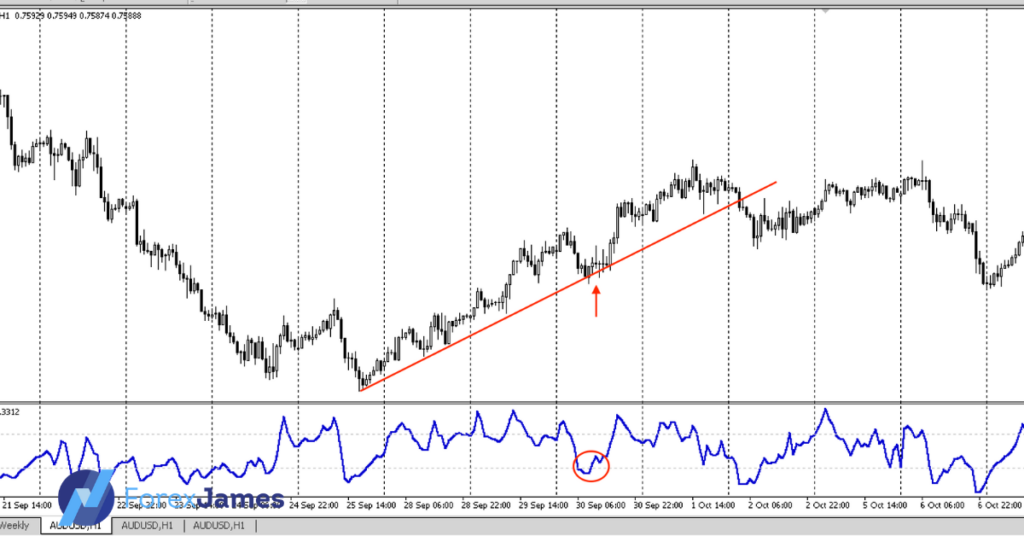
I seldom take counter trend trades these days, I’d rather wait for pullbacks and take trades in the direction bias. I love taking trendline bounces off a diagonal range. My stop loss can be placed below the previous swing high or low, and there is more than enough room for a 1:1 trade. If you need more confirmation, strike with the CCI as it becomes oversold or overbought.
Where To Take Profits?
Before price reaches the opposite side of the channel, or right on it. This is pretty easy to guess, isn’t it?
With all these information about chart patterns, let’s combine it with another important factor, which is the best time to trade forex.
The Best Time To Trade Forex
If you’re a day trader, it’s worth noting the time/session you’re trading in. Why am I bringing this up in our chart patterns forex discussion? It’s to increase the odds of them playing out.
If you’re expecting a price pattern to play out or a breakout to happen, would it not make sense for it to happen during the busy sessions?
Here is a table with data from babypips.com.
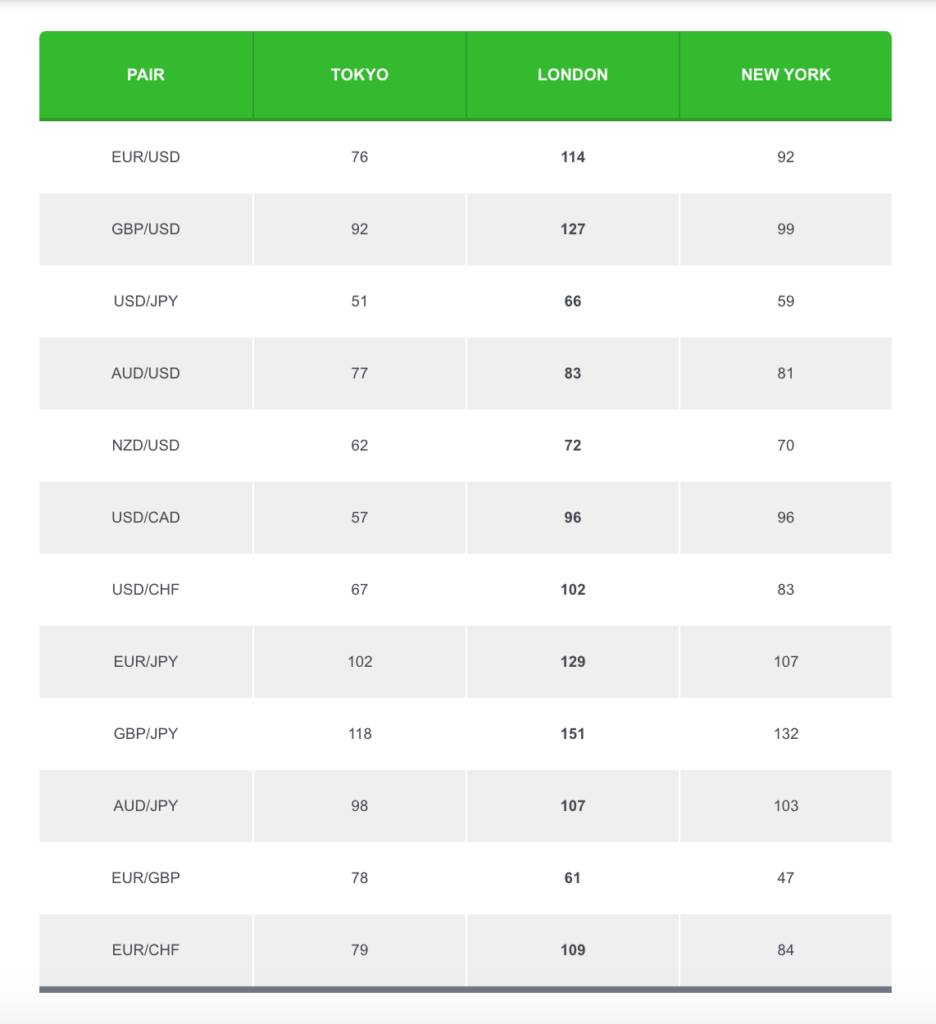
If you’re a day trader, the best time to trade forex is indisputably the London and New York Sessions. You want a surge of momentum to easily bank those pips, so why trade it during slow sessions?
Besides choosing the best time, knowing which pairs to trade can also give an extra edge. Pay attention to economical news releases (forexfactory.com) as well, for pairs that will be affected by the upcoming news. As I’ve said earlier, one of the reasons prices range is because there’s uncertainty awaiting the numbers to be released. So combine it with a chart pattern that’s forming, that’s awaiting a breakout.
Direction bias + chart patterns + levels + divergences = these are the things that I look at everyday to take into consideration before pulling the trigger.
I hope you’ve gained some knowledge from reading this article.
After all trading is based on probabilities, and the better you are at stacking the odds in your favor, the more likely you’ll survive in the game. Thanks for reading and good luck in your journey!