Table of Contents
WHAT IS DIVERGENCE FOREX TRADING?
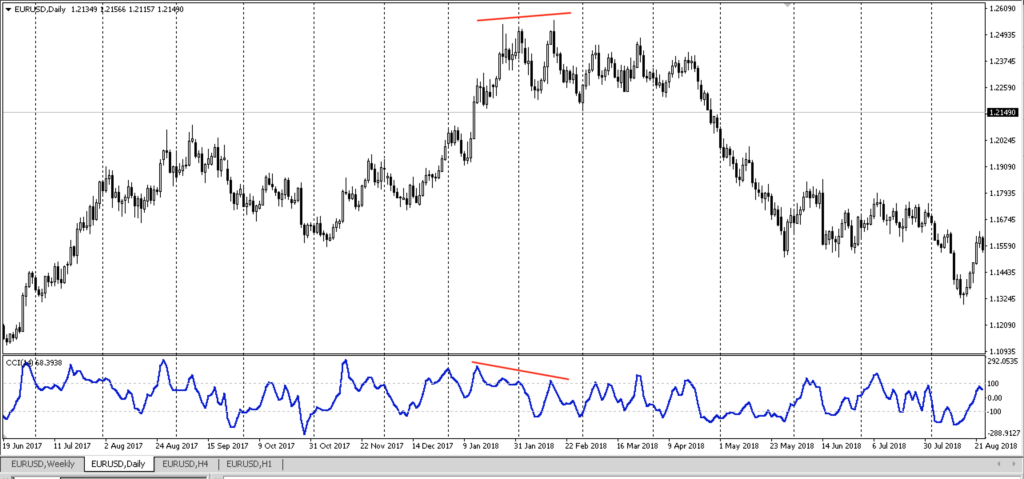
It’s when data from price and indicators diverge. When price goes up and makes a higher high, we expect the indicator to do the same, make higher highs. If the indicator fails to make a new high and makes a lower high instead, it has diverged from price.
We use an oscillators such as the RSI, CCI, MACD, Stochastics and so on to spot divergences. I chose the CCI for no particular reason really, I just tried it and decided to stick with it. It looks clean and simple, with just a single line.
Indicators are lagging in nature, so when we take signals from them, understand that the MOVE HAS ALREADY HAPPENED. Using divergences is not. We are using the indicator differently than what it’s meant to do.
Let’s get deeper into their types. Regular VS Hidden Divergences.
REGULAR DIVERGENCE = REVERSAL
HIDDEN DIVERGENCE = CONTINUATION
DO WE TAKE EVERY SINGLE DIVERGENCE THAT FORMS? NO.
I like to trade them in the direction of the upper time frame’s trend. Once a trend has been established, it’s likely to stay that way. Think of a trend just like energy. You’ll need an equal opposing force for it to change its direction. I’m not very fond of taking counter-trend trades, which are typically more aggressive.
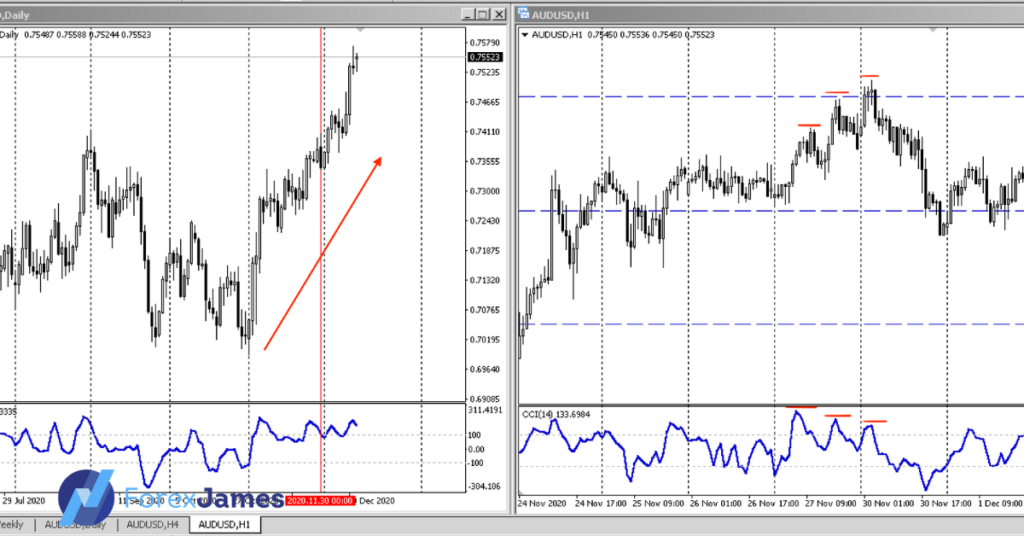
It’s all about knowing when to use the right tool at the right time. Taking a sell because a regular divergence forms in a strong uptrend wouldn’t make a lot of sense to me, I’d rather wait on a hidden divergence and go with the trend. Though in this case, you’d be able to bank in some pips if you had taken a short. The daily’s uptrend on this chart is a very steep one, and I wouldn’t want to go against it. Remember this, what may look like a reversal in the lower time frames, is simply a pullback in the higher one. It’s not an easy concept to grasp, but just remember that the higher time frame plays a bigger role.
INTERESTED IN TRADING DIVERGENCES?
Divergence has helped me to become a better trader by becoming more objective. There is no guessing involved in most cases, you either see the divergence or you don’t. With a trained eye, spotting one should be an easy task. I use it for a number of reasons outlined below.
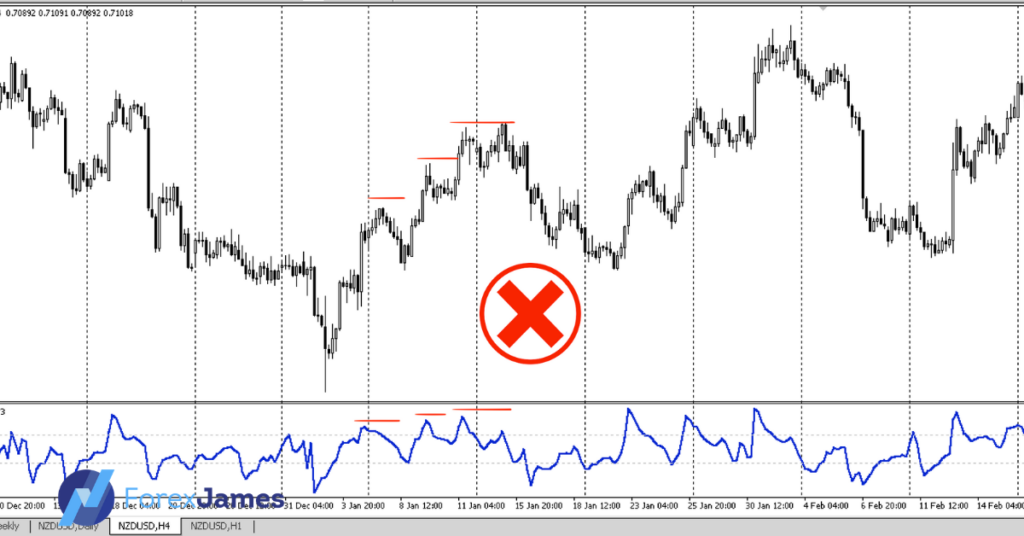
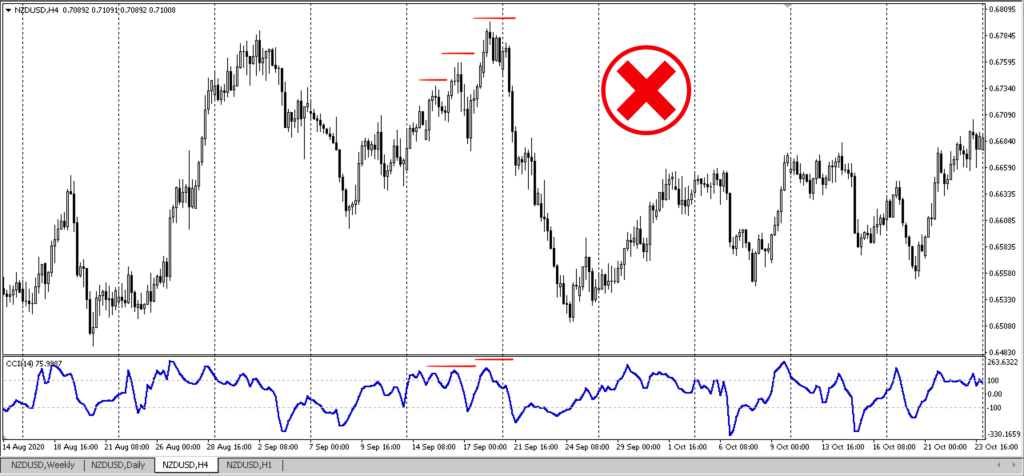
But before that, let’s look at some examples that are NOT divergences. When indicators follow or converges with price, it’s not.
FOR DIRECTION BIAS:
Use a time frame higher than your entry time frame for this one. If you’re executing on the H1, you may look at the H4 or D1. If you’re a day trader who executes on the M15, then look up to the H1 and H4. Once the bias is formed, only take trades in its direction, not against it.
FOR ENTRIES:
No divergence means no trade, it’s as simple as that. Use it as a VISUAL TRIGGER for your entries. When you feel like jumping the gun due to anxiety, or too afraid to pull the trigger after taking a loss, go back to what you see and trade it, no gut feel involved.
FOR EXITS:
Why use it only for entries? After all the reason to exit a trade is if there is an opposite entry signal, which in this case, is another divergence that points to the opposite site. If you’re afraid of letting your winners run, this will certainly help you stay in your trade longer. You will undoubtedly see pullbacks and your profits dancing up and down, but inevitably a trend will continue to make new highs and lows.
Watch the video below to learn more about it.
DIVERGENCE TRADING EXPLAINED
I don’t solely use divergence, I use it as a part that integrates with my whole price action trading system. (Learn more about The Complete Price Action Course here) But I figured the reason you’re reading this is because you are fascinated with trading with divergences. So let’s create a mechanical trading system solely based on divergence and multiple time frames.
Which Indicator Is The Best For Divergence
Many momentum oscillators produce divergence signals. The only way to determine the best one for the market you want to trade is by backtesting and selecting the top performer. As you know, we emphasize systematic trading, and what we have found is that no matter which indicator you use, measuring the effectiveness of divergence strategies can be challenging.
However, there are numerous indicators that you can utilize for divergence strategies. Some are based on pure price action, while others rely solely on volume data or a combination of price and volume data.
Below are some examples of the best indicators/oscillators to use for divergences:
1. Relative Strength Index (RSI)
2. Moving Average Convergence Divergence (MACD)
3. Stochastic Oscillator
4. Commodity Channel Index (CCI)
5. Money Flow Index (MFI)
6. Rate of Change (ROC)
7. Awesome Oscillator
8. Accumulation/Distribution (A/D) Indicator
These indicators are commonly used by traders to identify divergences between price and momentum. However, it is important to note that the effectiveness of these indicators may vary depending on the market and the trading strategy employed. It is recommended to test and experiment with different indicators to determine which ones work best for your trading style and preferences.
Click here for more info on indicator is best for divergence.
THE FOREX DIVERGENCE DAY TRADING SYSTEM
I consider myself to be a day to swing trader. On average, I’d hold positions from a few hours to a few days. I’m not an intra-day trader, a trader who only trades during day time and closes all positions when the market closes (at least this applies to stocks). With that being said, let’s jump into the nitty gritty of the system.
DIVERGENCE DAY TRADING FORMULA:
HTF-Direction Bias w/Divergence + LTF-Entry w/Divergence (Time frames to look at D1, H1)
When to look for buys:
Daily divergence bias UP + Divergence buy setup on the H1
When to look for sells:
Daily divergence bias DOWN + Divergence sell setup on the H1
Ready? Let’s look at some examples.
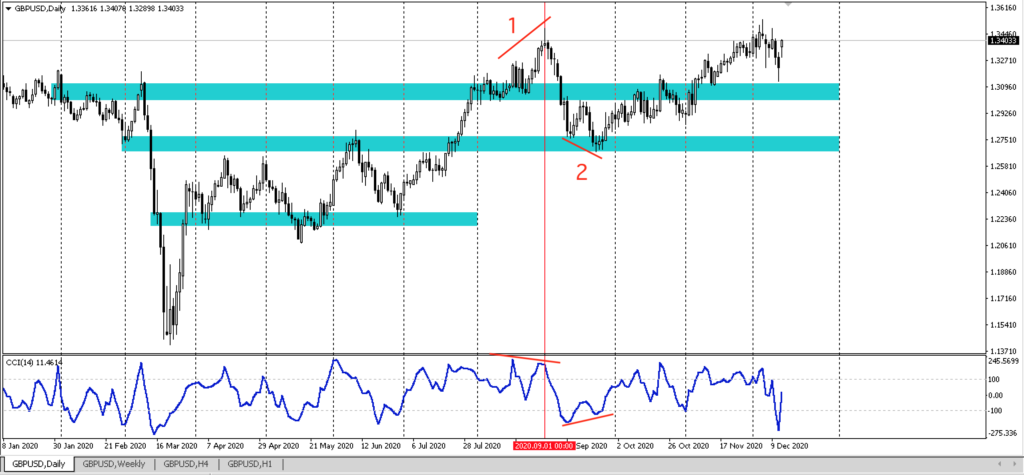
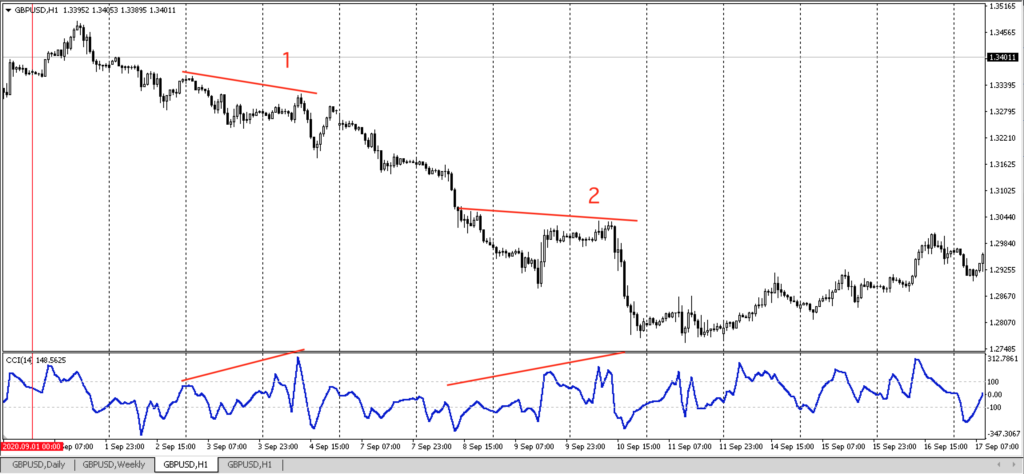
EXAMPLE 1:
GBP/USD – Daily bias is down from point 1 onward because a bearish regular divergence formed. The bias should be to the downside all the way until an opposing divergence forms at point 2, from which point you’d only look for buy signals. So with the green light to sell on the daily, we’d go down to the H1 to only look for sell signals, which can be found with the two hidden divergences marked as 1 and 2 on the H1 chart.
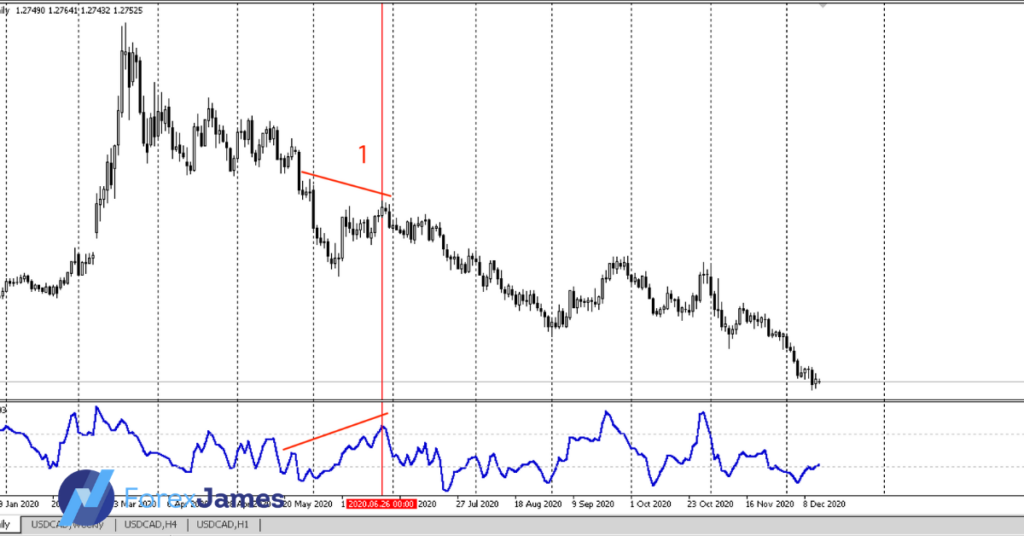
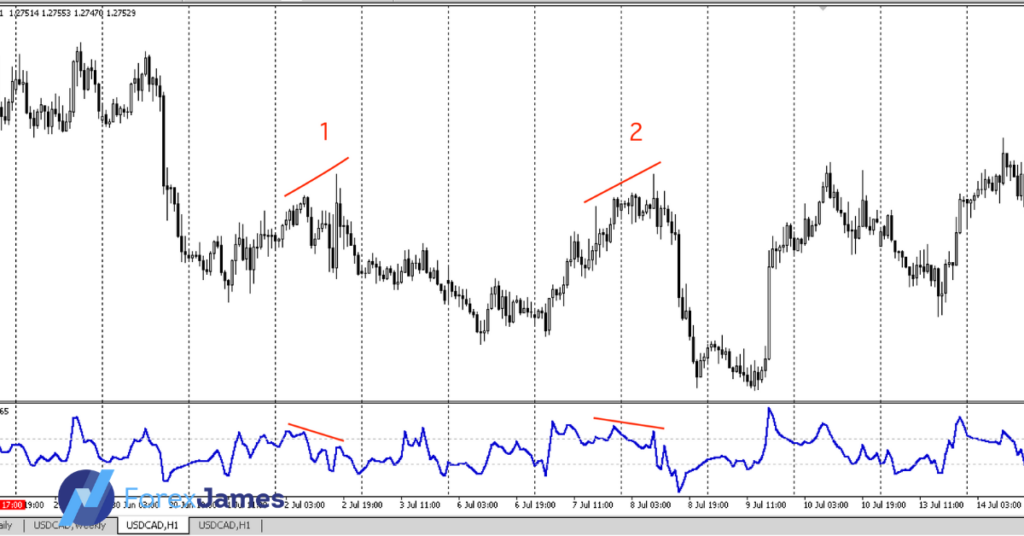
EXAMPLE 2:
USD/CAD – On the daily at point 1, we have a bearish hidden divergence formed. It’s trend continuation signal that tells us that the down move is not over. From that point onward, only look for sell setups on the H1. We have on the H1 at point 1 and 2, bearish regular divergences. It’s the perfect entry to rejoin the bears at the end of the small rally/pullback.
I’ve picked these examples to showcase the simplicity of the system and the profit potential it can bring. There will be losing trades, just like any other systems out there, but as long as the winners outweigh the losers, you’ll be fine in the long run.
There are other factors to consider like the supply/demand levels, price patterns, impulsive vs corrective wave which we’re not going to cover here. For a complete breakdown of them, they’re available in my price action course which can be found here.
Adding divergences in my repertoire has definitely improved my performance and I’d highly recommend that you use them in your analysis too. Cheers to your trading success!
(Learn more about The Complete Price Action Course here)