Table of Contents
How To Draw A Trend Line?
Some people would draw it on wicks while others on the bodies. The angles can also vary, depending on your own perspective. I will show you a tool that can help you draw your trend lines, if you need some guidance. Click here for more info on trendline strategy on the web.
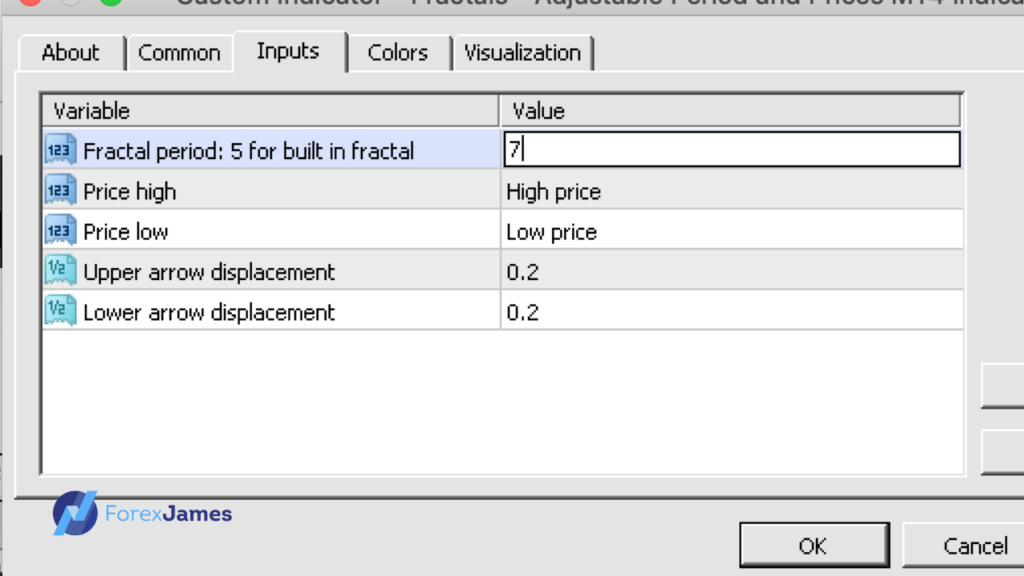
I use a 7 candle period Fractals (free from ForexFactory.com) instead of the 5, cause it helps me see things clearer. I also draw my trendlines on the wicks, not on the bodies. Remember that this is merely a guideline, at some point you may opt to not use it anymore once you’re more confident.
Download the adjustable fractal for free here: https://bit.ly/3L3wtRv.
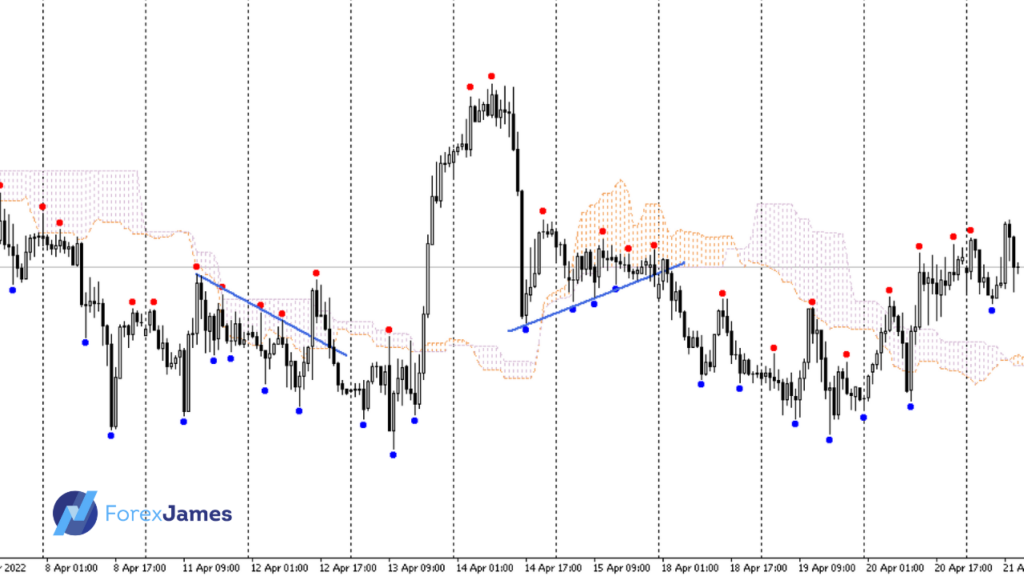
As a general rule of thumb for drawing diagonal trendlines, a 45 degree angle trendline can sustain longer than a steeper one.
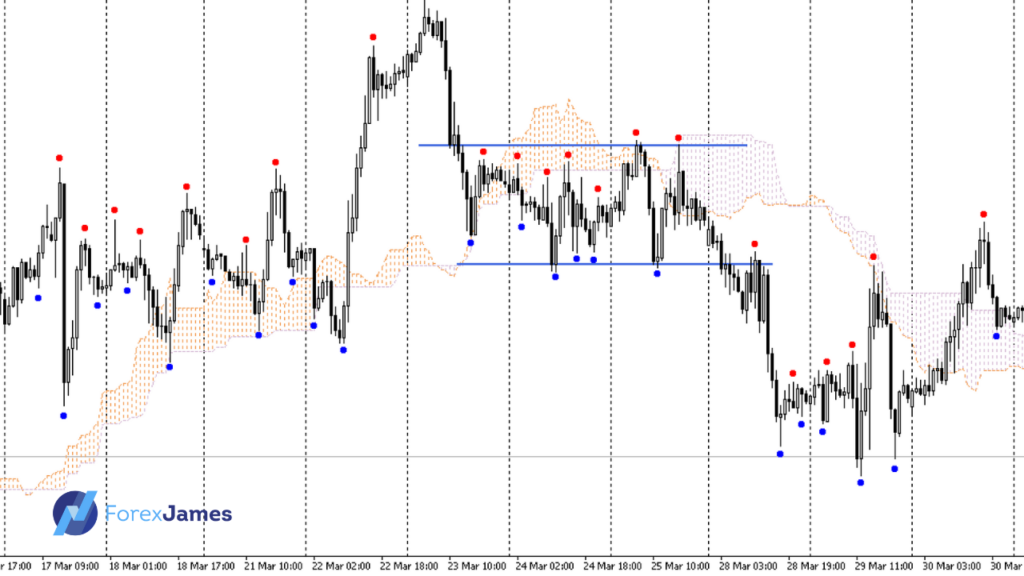
For horizontal lines, we draw the most recent support and resistance lines. We simply find an area / zone that intersects the most with price. The fractal indicator does not play much role in helping us draw the horizontal line.
Why Wait For A Trendline Break?
- We wait for price to tell us where it’s going
- We won’t be the first to enter
- We trade what we see
The short answer is because we need to see prices going our way as a confirmation. Prices have its way of confusing us traders, by creating bull and bear traps. There are other tricks like fakesout and stophunts as well, that exists to induce traders to get into the wrong side of the trade. By not being the first to jump in and engage in the market, we’d rather wait for prices to play out and we choose to enter with confiramtion, sacrificing a portion of the move.
Trend Line Trading Strategy And Multiple Timeframe Analysis
- Get a direction bias
- Look at structure HH HL or LH LL
- Entry timeframe – look for ranges and patterns
- Enter on a breakout or a fakeout
Having a direction bias is ultimately what having an edge in the market means. I refer to the D1 (Daily) timeframe to get an idea of where price is headed to. I look for higher highs and higher lows or lower highs and lower lows plus chart patterns to help me decide on the direction bias. The H4 provides a shorter term outlook (usually weekly), and it may give a slightly different perspective from the Daily. I zoom in further to the H1 to look for ranges that I can trade the breakouts from.
In a nutshell that’s how I’d implement the trendline break system and combine it with price action analysis.
The Trendline Break And Retest Strategy
This is one of the most common strategies that is widely known. We don’t immediately enter at the first attempt of the breakout, but rather wait for prices to pullback to the initial breakout point, before entering. If you choose to do this, be prepared for situations when prices would just take off, without making any pullbacks, which means you’d miss the trade. Other times when prices do make a pullback, you’d be able to get a better entry.
Interested in trading with our Parabolic SAR EA? Click here.
Trend Line Indicator MT4 And EA (Expert Advisor)
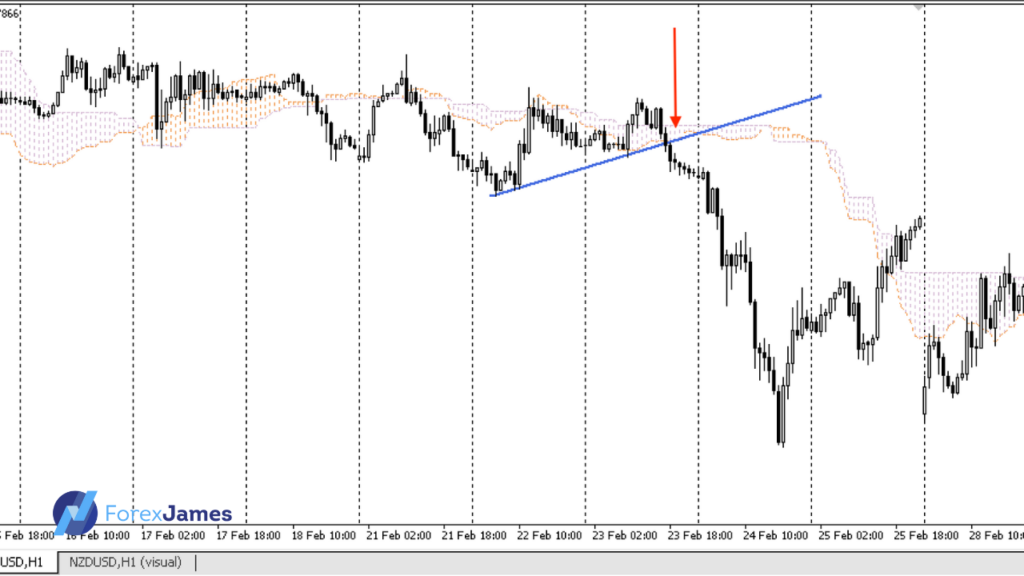
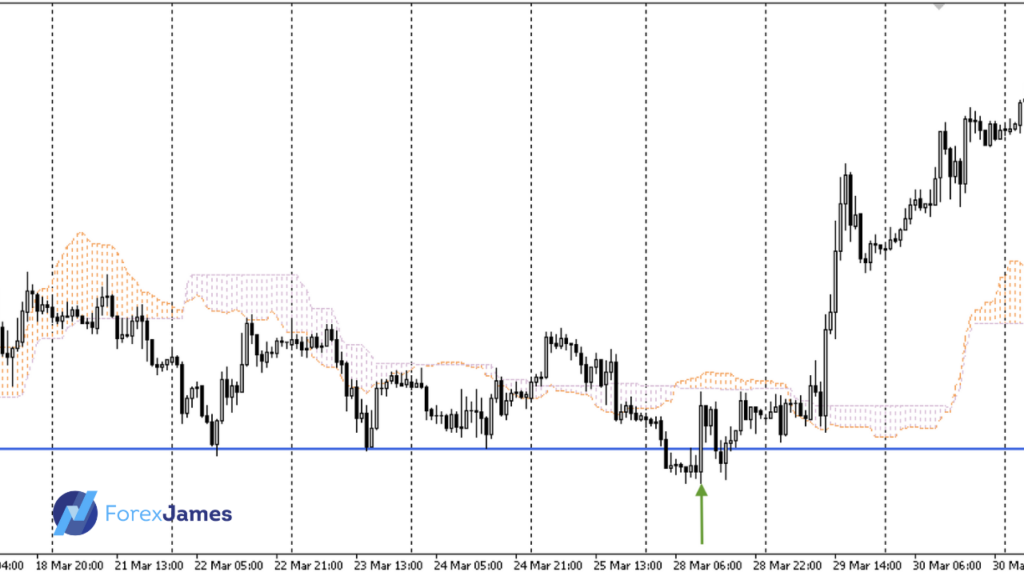
You can use the trendline EA for breakouts or fakeouts on a horizontal trendline or diagonal ones. The breakout EA can detect if it’s going to buy or sell, depending on if the current price is below or above the trendline. If you draw the trendline below prices, it will look for sells and if you draw it above prices, it will look for buys.
For breakouts, we’d enter immediately when it attempts to break the trendline. We want to participate in the market as soon as price made a confirmation and move towards it. If you are day trading, pay attention to the session you’re currenly in. More often than not, breakouts happen during high volume sessions such as the London and New York hours.
For fakeouts, we’d use the EA to get back into the range, as we fade the breakout. Once price closes back inside the range, we can safely assume that the breakout has indeed failed. Remember that prices can only go up or down, if it fails to go one way then it’s likely to go the opposite way.
Watch The Video Below To See A Clear Example Of Such Situations:
The EA Comes With The Following Settings:
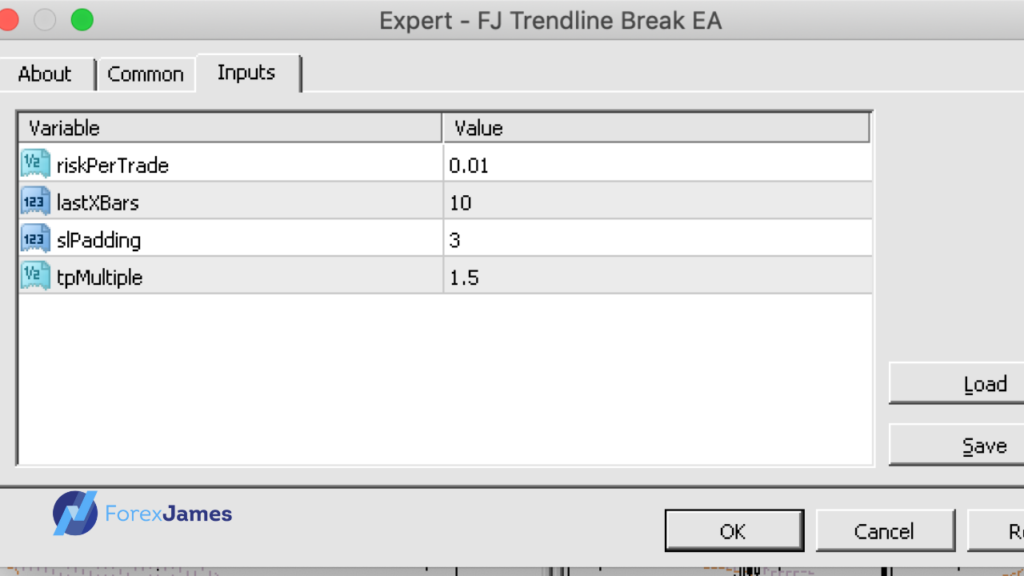
For buys, it will place its SL below the lowest point of the lastxbars and a few pips of padding. For sells, it’s the opposite, the SL will be placed above the highest point of the last X previous bars.
SL Padding:
a few pips gap is recommended to take into account for the spread of the pair. In some cases, price would make deep pullbacks and form equal highs/lows and if there were no padding, your SL would have been triggered.
Based on your SL distance and your balance, the lot size placed will be based on your risk per trade. 0.01 is the default settings and it’s for risking 1% of the account balance, it doesn’t factor in if there are any open trades with floating equity.
TP Placement:
It’s set at 1.5, which means that we are aiming for 1.5 times the amount of pips between entry and SL, aiming for 1.5R trade. For breakout trades, we typically aim for a 1.5R and for fakeout trades, the potential payout can be more as we can get an earlier entry.
The EA is meant to assist us traders, not to replace us. It’s semi automated and we only apply it on the charts at certain periods, when we are about to engage. It does the heavy lifting for us by calculating the optimal lot size and placing our SL and TP levels. It allows us to walk away as we won’t have to stay on the charts during execution.