Table of Contents
What Is The Fibonacci Sequence In Forex?
A natural sequence that occurs in nature. “The golden ratio is about 1.618 and is represented by the Greek letter phi, the study of the relationships between numbers, quantities, shapes, and spaces. relationship between numbers or numerical values.” Learn more about Fibonacci on the web.
Some traders bet their lives on it that they work on the markets as well. In my opinion, they work because the levels coincide with support/resistance levels, where real orders are actually in place.
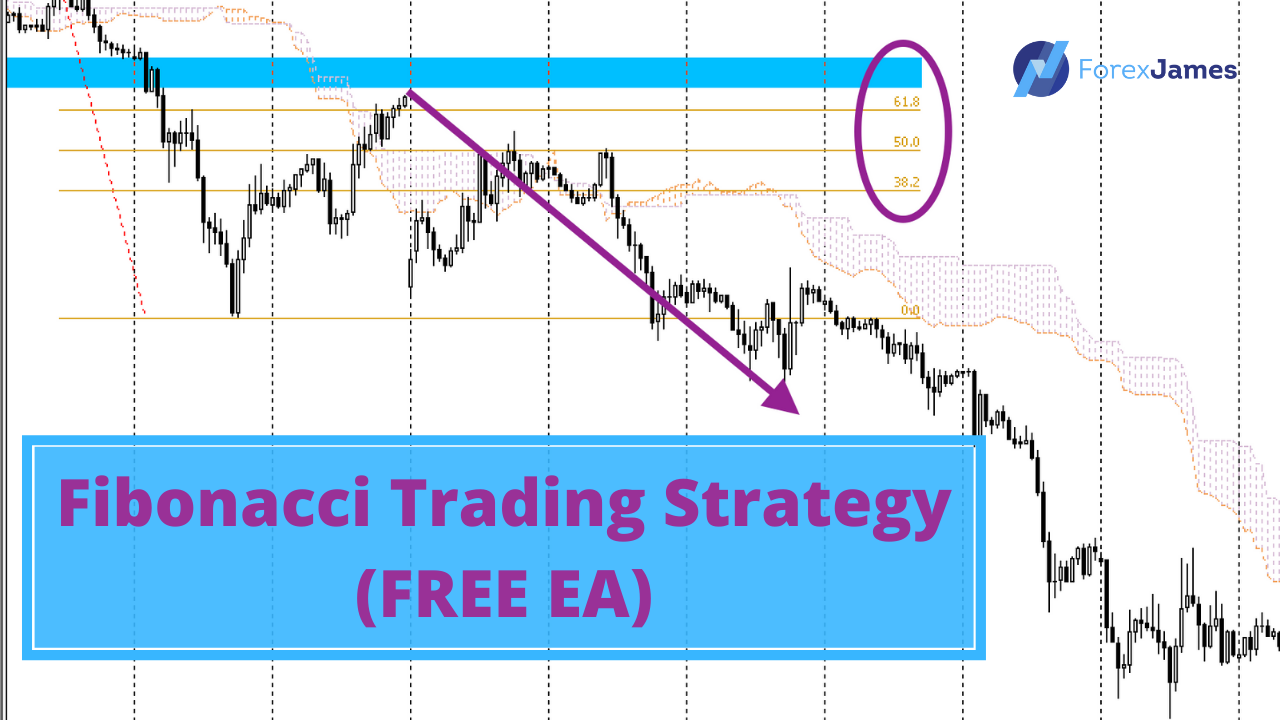
Some of the popular fib numbers are 38.2 and 61.8, which traders use to enter on a retracement. These are levels in the market where a turning point is anticipated and are regarded as optimal entry points if you want to participate in the main trend. The 161.8 is also a fib number that traders use to project where the market is headed. It is often used as an exit point or take profit levels.
Let’s Talk About How We Can Combine Fibs With Our Price Action Analysis Below.
Price Structure – Uptrends & Downtrends
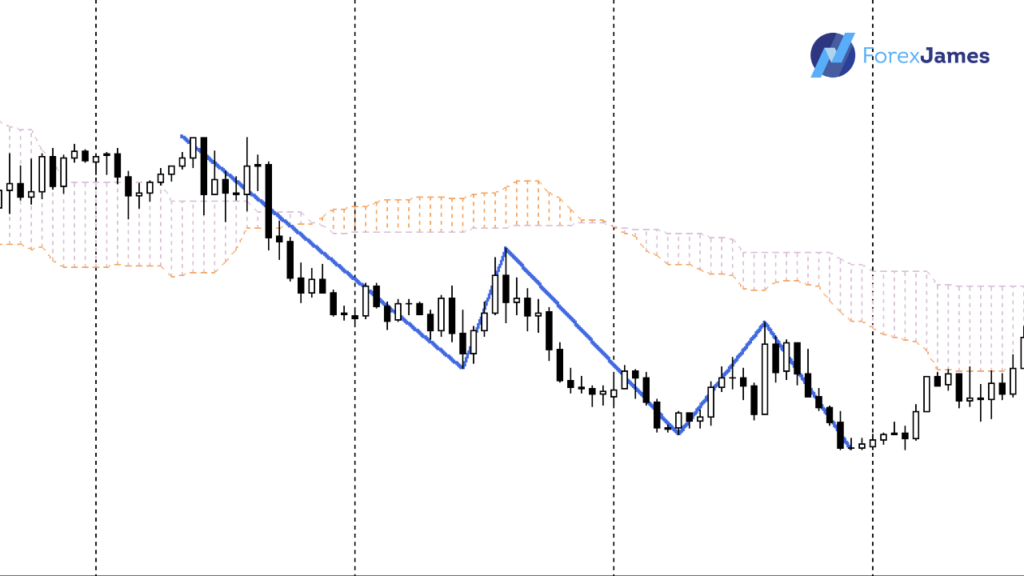
Learn to identify swing points and where the impulsive waves are actually at. Impulsive waves are the moves that break previous highs and lows, while corrective waves are the pullback waves. Spotting HH HL LH LL is one of the basics of price action trading and by understanding it, we can decipher if we’re in an uptrend, downtrend, or a range.
Fibonacci traders believe in the saying The Trend Is Your Friend Until It Bends. We’ve heard this saying many times and many legendary traders have sworn by its truth. After trading for many years, I mostly trade with the trend and barely make counter-trend trades. It’s just easier if you’re going with the flow i.e. the impulsive wave, as more momentum is present and your TPs can be achieved faster.
If you’re trading with fib retracements, then you’d fall into this category of traders as well.
My advice is that once you’ve identified the long-term trend, don’t go against it.
Fibonacci Retracement In Forex – Pullback Entries
If we were to divide the types of trades into 4 categories, they would be breakout, pullback, counter-trend, and range trades. Breakout traders enter at a worse price, they’d rather wait for a price confirmation for more assurance. Counter-trend traders go against the herd, hoping for a quick pullback to make quick profits, while the main trend makes a pullback. Range traders go back and forth between the identified ranges and do not trade outside of them when a trend happens.
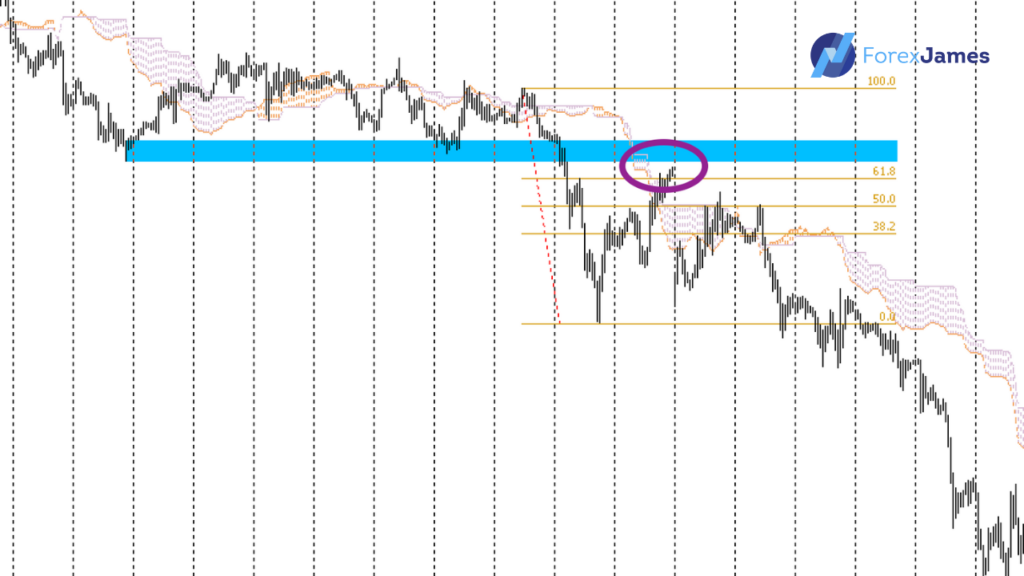
Fibonaccis are for pullback traders, who wish to enter the markets on a discount, i.e. a better price. They’ve identified a level in which they’d be interested to enter, in hopes that the trend will continue. Pullback traders get hurt at the end of the trend when it falls into a range or turns in a different direction. If they’re good enough, they may still get out of a smaller loss or break even.
Forex Fibonacci Extension
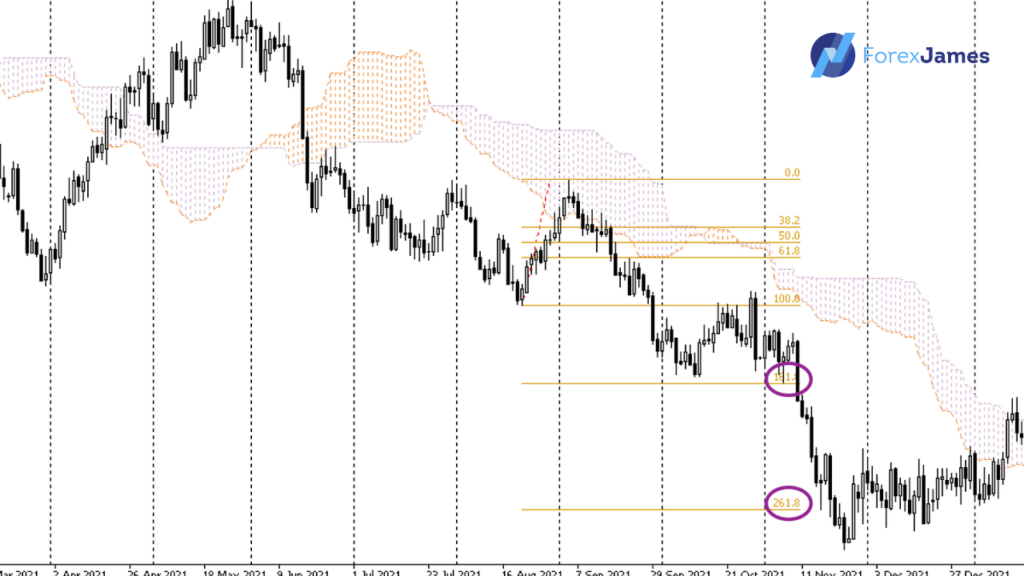
The other benefit of fibs is using it to measure our exit target/ TP. By pulling the fibs on the corrective wave or the BC leg (in the ABCD pattern), we can measure where the price is likely headed to. For me, the 161.8% level has been pretty accurate and if you’re still uncertain of where you can place your TP, you may use the fib extension. At times when the trend is really strong, we can even reach the 261.8% level, but usually not before a period of range, after the 161.8% level has been hit. Again, use fibs with a slight discretion and keep in mind that the lines should be regarded as zones, rather than just a line.
If you prefer using the ABCD pattern to measure the target, that would work as well. Whether you’re using the fibs or the pattern, these are simply just tools to measure the projection of price. As long as you’re making trades that can yield a bigger reward-to-risk ratio, you’ll be fine in the long run.
Read more about the Parabolic SAR EA here
Read more about the Trendline Break EA here
How The Fibonacci EA Works
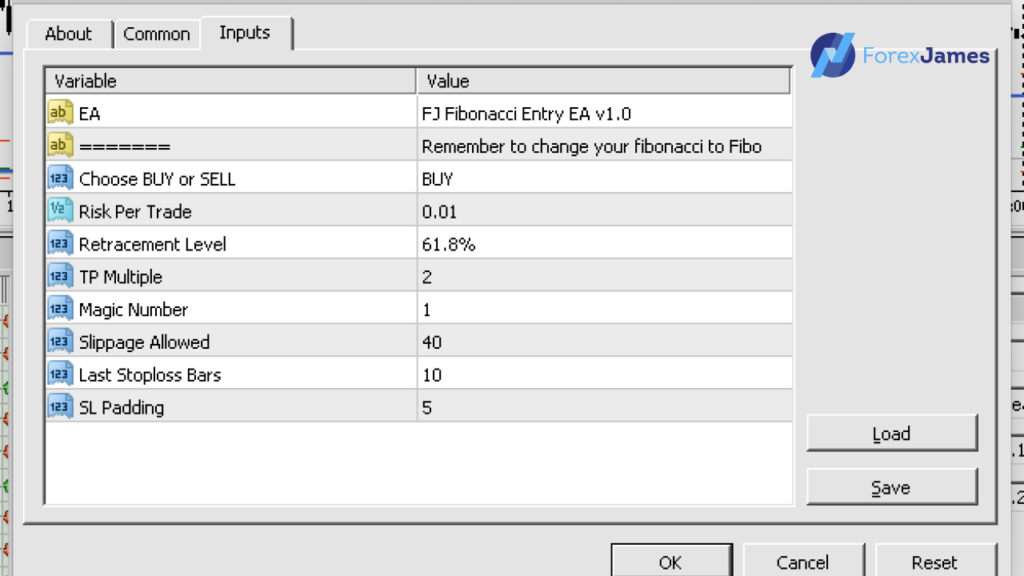
- Change the name of your Fibonacci to just “Fibo”.
- Enter the desired mode – Choose BUY or SELL. The EA can only be in 1 mode at a time. For buys, it will enter on price dips and for sells it will look for rallies.
- SL – Placed below or above the high or low of the last bars.
- TP – A multiple of the distance between the entry and stop loss distance. An easy way to measure risk to reward.
- MagicNB – There can only be one open trade with the same magicNB. If you choose to add the Fibo EA to a second chart, be sure to use a different number.
Slippage, SL padding, and the Last Stop loss bars are recommended to be left at their default settings.
Drawing the fibs is pretty straightforward, you can watch the video below for an easier demonstration and also more details on how to use the EA.
The Trigger: Fibonacci Forex Trading Strategy
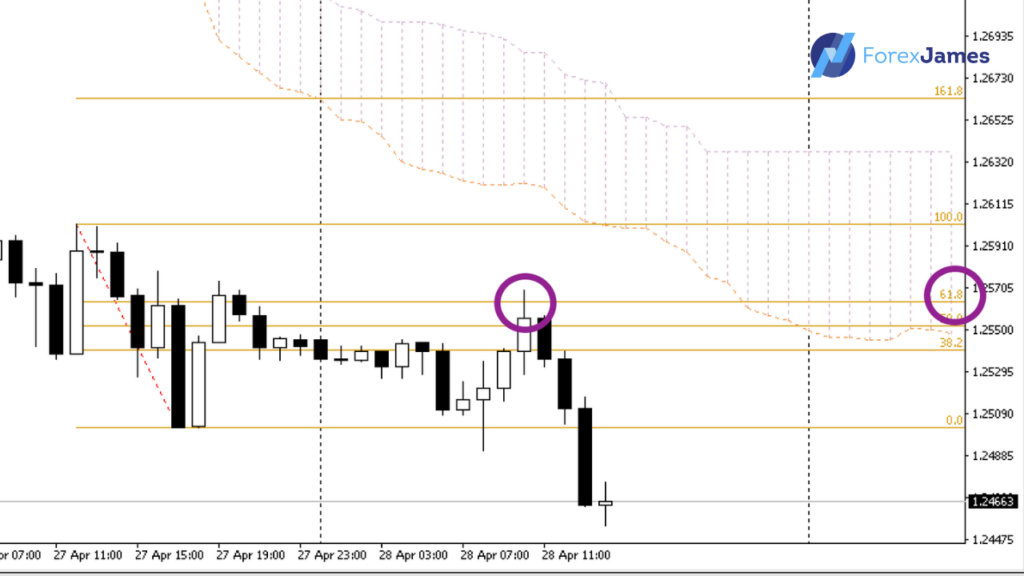
Depending on the level of retracement you choose, for buys, we wait for a candle close below it and the next candle to close above the line. For sales, we wait for a candle to close above the specified pullback level, and the next candle to close below the level. We don’t just enter based on the wicks or highs and lows of the candles, they need to close beyond the line for the EA to consider it to be valid. Once the trigger is met, we would enter immediately at the candle open. I have created this trigger to filter out the noises and spikes in the market so that the signals are more accurate and fewer will be created. Yes, this would mean that we would miss out on some trades, but I’d rather trade less and take quality setups.
Fibonacci Forex Trading
It’s a semi-automated EA meant to aid traders in the execution aspect of trading. It does all the calculations in finding the optimal lot size, based on the risk, finds its stop loss, and sets the top as well. You as a trader still have to decide and pick a direction, up or down, and look for areas for entries that can yield positive rewards to risk trades. In the long run, that’s how we stay in the game as traders, by guessing the right direction more often and winning more on the winning trades. Click here for more info on Chart Pattern Forex.
Get the free EA in our Forex James VIP Telegram Channel here.
Discover Fibonacci In nature
The article found at science.howstuffworks.com uncovers the hidden secrets behind the Fibonacci sequence and the golden ratio that radiate the beauty of the universe.
The Fibonacci sequence, first discovered by Indian mathematicians in the 12th century and later documented in a book by an Italian scientist in the 13th century, follows a fascinating and mysterious pattern of numbers. The numbers in this sequence have a unique relationship where each number is the sum of the two preceding numbers.
Not only that but the Fibonacci sequence is also connected to the golden ratio, which magically appears in various natural phenomena. This ratio, known as the golden ratio or golden mean, has a consistent value that almost always emerges in awe-inspiring proportions and forms.
Through the Fibonacci sequence and the golden ratio, we can witness the astonishing mathematical harmony that unfolds in the wonders of nature. Here are some examples:
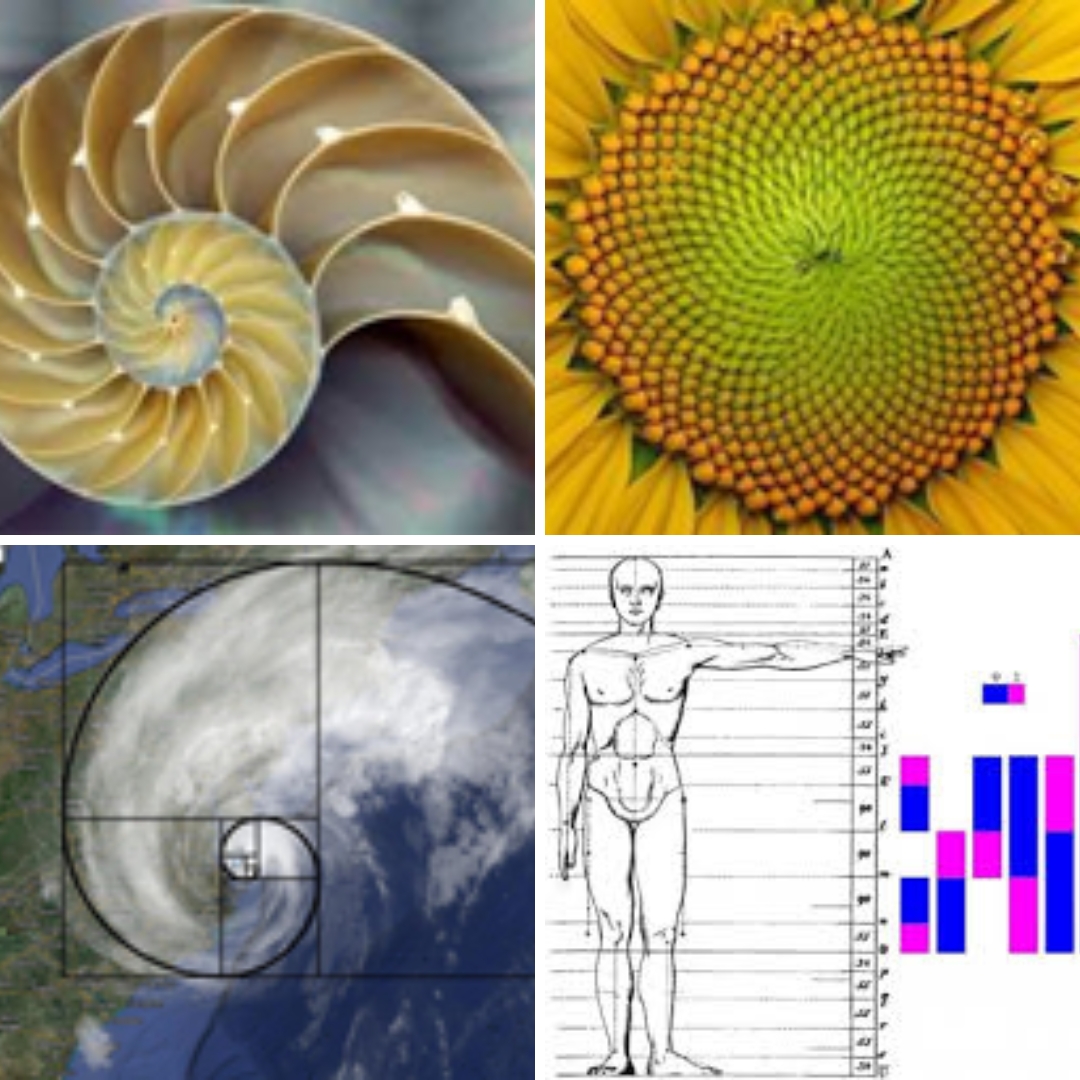
1. Seashells: The spirals in seashells closely resemble the spiral pattern in the Fibonacci sequence.
2. Flower Petals: The number of petals in flowers corresponds to the Fibonacci sequence.
3. Storm Structures: Storm formations, such as tornadoes, exhibit a resemblance to the Fibonacci sequence. The structure of a tornado’s wind can be observed to have a spiral pattern similar to the Fibonacci sequence.
4. Human Body: Many parts of the human body unknowingly follow the Fibonacci sequence, from the arrangement of facial features to the number of segments in limbs and fingers. The proportions and sizes of the human body can also be divided using the golden ratio. The DNA molecule follows this sequence, measuring 34 angstroms in length and 21 angstroms in width for each complete double helix cycle.
These examples highlight the profound connection between mathematics and nature, demonstrating the remarkable presence of Fibonacci numbers and the golden ratio in various aspects of the natural world.