Table of Contents
- 1. How To Use Parabolic SAR In Trading2. Better Than A Trendline Break System
- 3. How To Trade Using The Parabolic SAR Indicator
- 4. The FJ Parabolic SAR EA (Expert Advisor) Features
- 5. Signal Entry vs Immediate Entry vs Pullback Entry
- 6. Pullback Entry (Discount)
- 7. Exits
- 8. Trading A Parabolic SAR Strategy – Download The EA
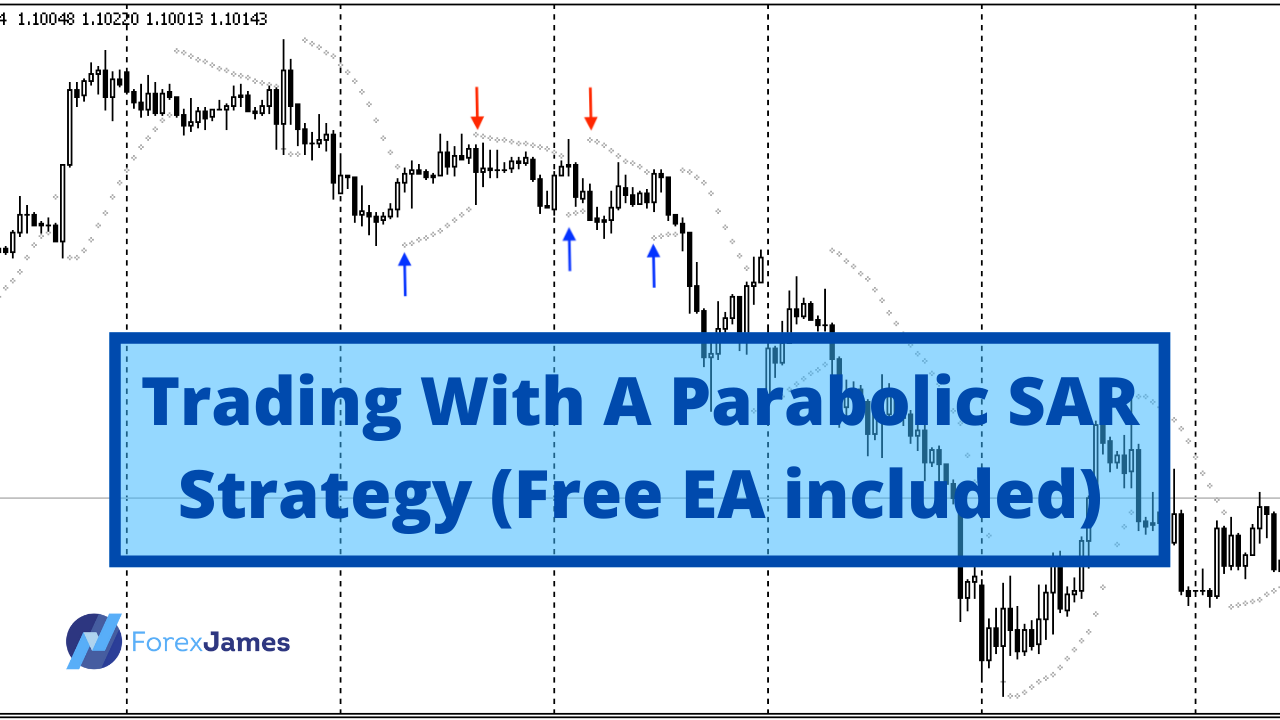
How To Use Parabolic SAR In Trading
Many indicators are provided by default on Metatrader and the Parabolic SAR is one of them. In case you don’t know, SAR stands for stop and reverse. It’s used by technical traders to spot trends and reversals. My weakness as a trader has always been that I tend to jump the gun too early. More info How to Use Parabolic SAR.
Often times my direction bias is pretty accurate but if I choose to enter on a dip/rally, there is a likelihood of getting stopped out by a stop/liquidity hunt first. I need to find a solution for my weakness, and that is to wait until the move has happened in the intended direction. That’s where the role of indicators as a trigger comes to play, as they are lagging in nature and objective. You need to trade what you see and the indicator will tell you just that.
If you’re interested in knowing the mathematical formula and how it’s calculated, read more about it here https://www.investopedia.com/terms/p/parabolicindicator.asp.
Better Than A Trendline Break System
Drawing trendlines are subjective. It can vary slightly from person to person and broker to broker since the price feed comes from different sources. Trendlines can also vary, depending on which points on the chart you wish to use. I’ve come to learn that the best trendlines that are respected are drawn at about a 45-degree angle. We use trendlines to give use guidelines by connecting previous price charts and projecting where future prices will head to.
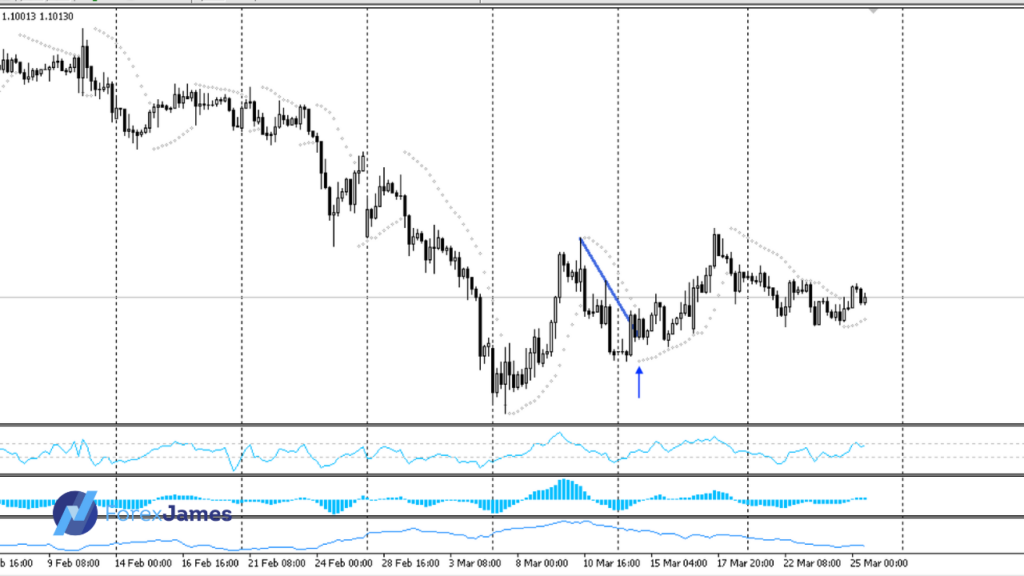
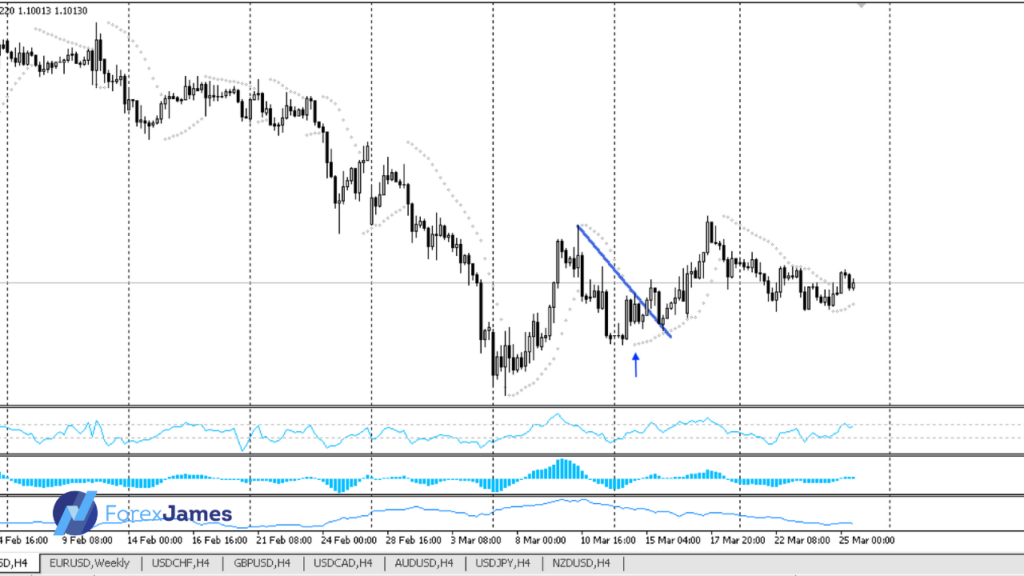
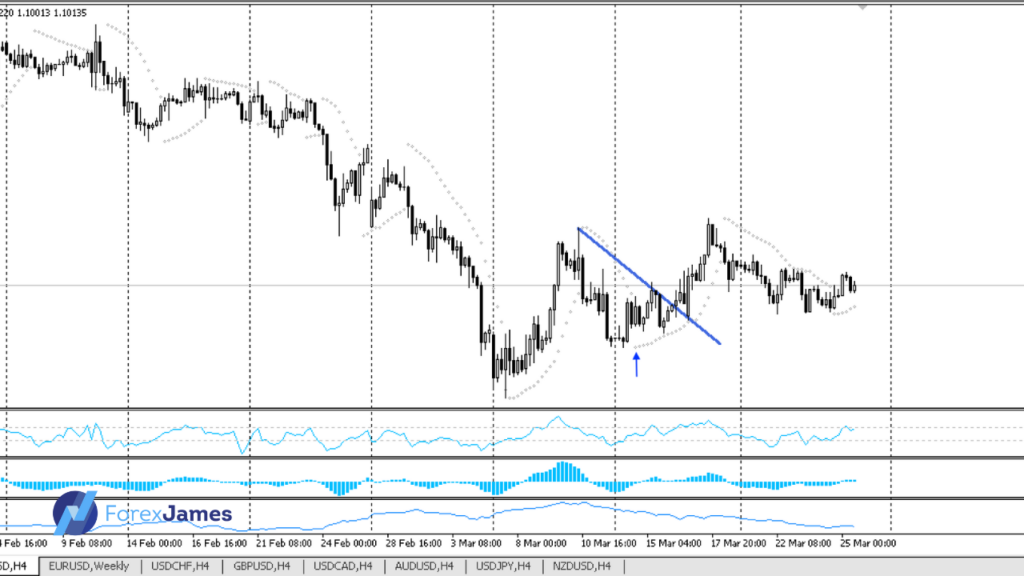
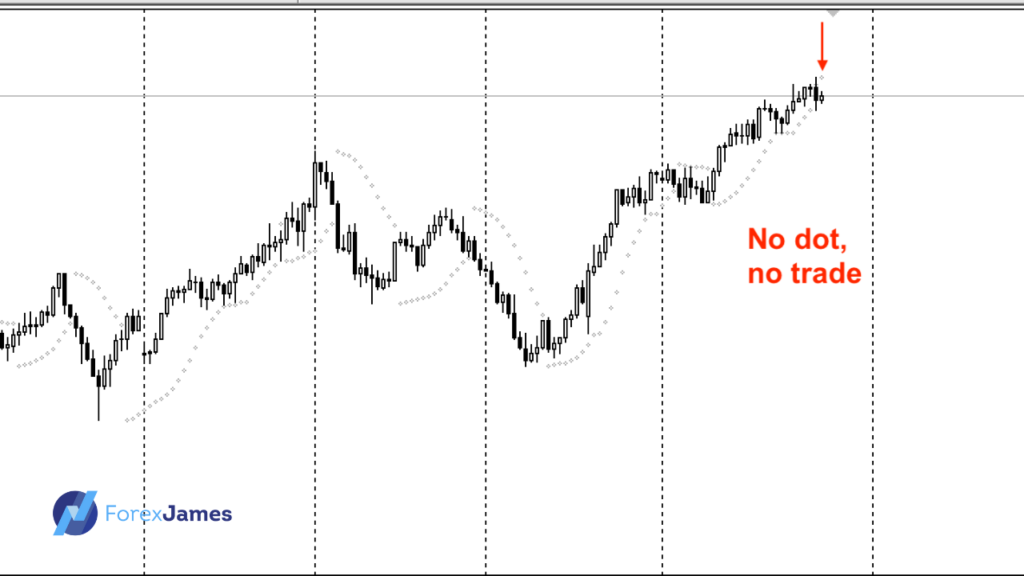
Notice how I drew the down trendline in three different ways, and none of them are wrong necessarily. How would you have drawn the trendline yourself? You can already see the advantage of using the Parabolic SAR Indicator, the dot stays there no matter what and it’s your green light to go LONG, for a continuation trade.
How To Trade Using The Parabolic SAR Indicator
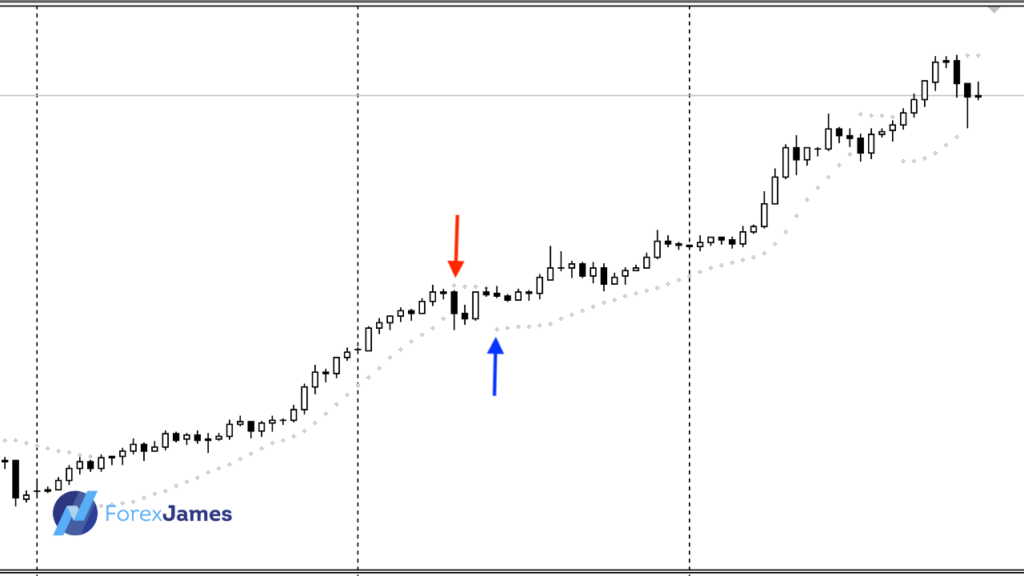
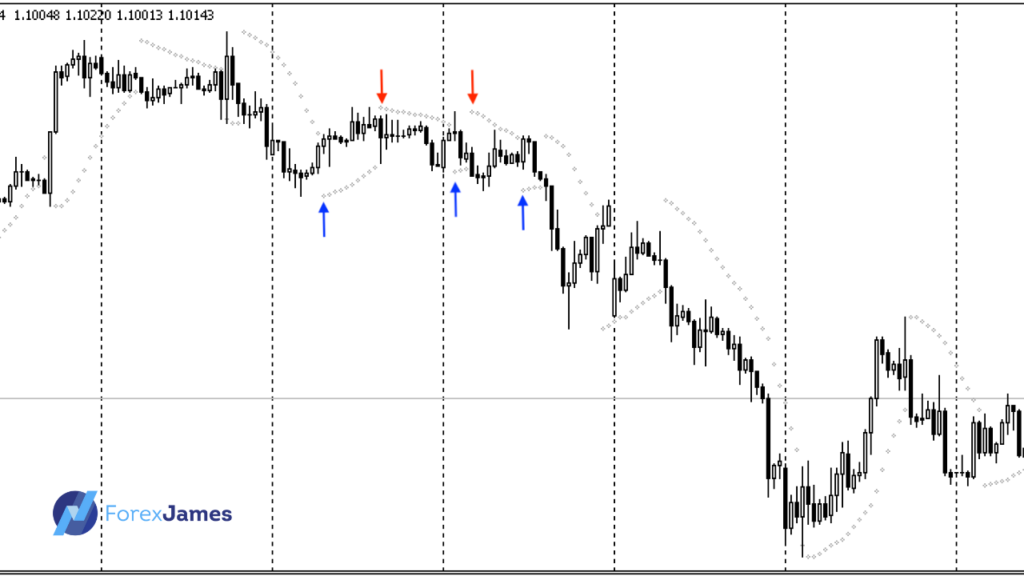
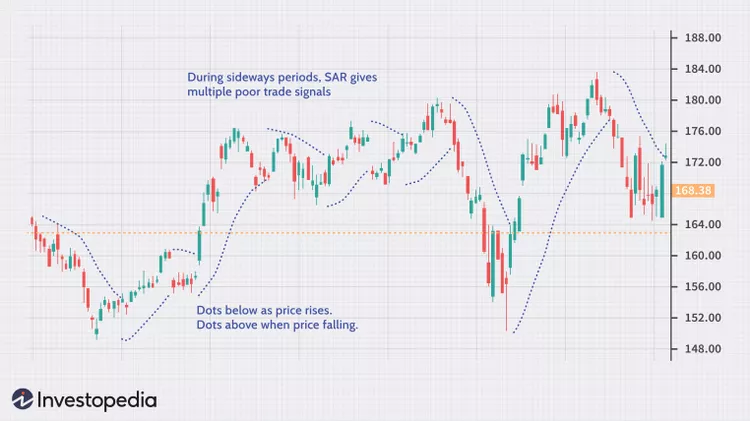
When the SAR dot is beneath the current market price, it points to an uptrend and when the SAR dot is above the market price point, it points to a downtrend.
The crossover: Enter a position when the price penetrates the SAR – buy if the price crosses above the SAR and sell if the price crosses below the SAR. This is what I call the crossover, just like when a fast and slow-moving average intersects and crosses.
More than anything else, the dots are really helpful visual cues for price action and technical traders like myself. Last but not least, like any indicator, the Parabolic SAR lags and does not predict future price movements. It may also give you false signals when the market is in a range mode.
Why enter on a pullback you may ask? It’s for a better reward to risk ratio. Please understand and accept that by waiting for a trade to come to you, you may miss out on the move entirely should it take off immediately.
Learn more about Price Action Trading here.
The FJ Parabolic SAR EA (Expert Advisor) Features
Risk Per Trade
Risk per trade – 0.01 means 1% risk per trade. The lot size will be computed automatically so that if the trade were to end up in a loss, you will lose 1% of your account balance. We recommend that you risk a maximum of 0.02 (2%) per trade for proper risk management.
Magic Number
Magic Number – this is a safeguard feature that will prevent the EA from opening multiple trades from the same signal. There can only be ONE trade with the same magic number at any one time (active and pending orders included). If you wish to use the EA on many charts, please use a different magic number each time.
Signal BUY/SELL
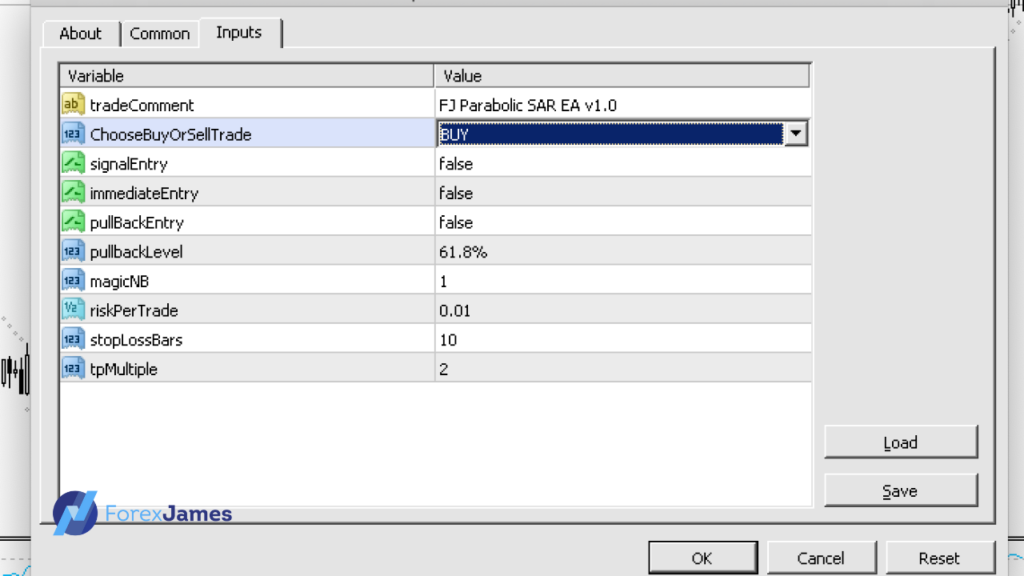
Choose the mode u wish to trade in. For BUY, it will place a trade when a lower dot prints after a series of upper dots. For SELL, it’s the opposite, when an upper dot prints after a series of lower dots. Since it’s a semi-automated EA, you need to set the mode in the beginning and it will only look for trades in the desired direction.
Signal Entry vs Immediate Entry vs Pullback Entry
Signal Entry
This is the default setting. Enter immediately when a signal cross-over occurs. Sometimes when the momentum/move is strong, you’ll miss out on the move if you opt for the pullback entry mode.
Immediate Entry
If you wish to participate in the market immediately, be it for a buy or sell and regardless of the current SAR signal. It will enter the market, place an SL and TP and calculate the lot size accordingly.
Pullback Entry (Discount)
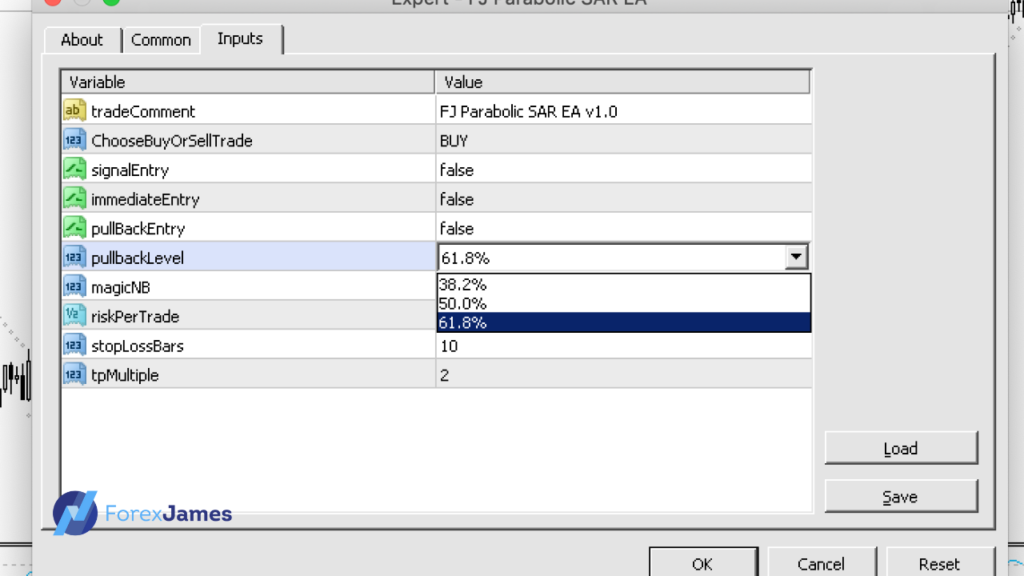
Choose your pullback level from 38.2%, 50.0% & 61.8%. The EA will automatically enter a limit order which will expire within 12 bars if it’s not triggered. This is a good option if you notice that the distance between the entry and SL is too wide, and you’d want to improve the reward to risk ratio by getting a better entry, closer to the SL, allowing for a potentially bigger multiple on the TP.
Exits
SL
The EA uses the most recent swing low or high point to set the SL. set the number of previous bars for the EA to calculate the lowest or highest point (a few pips is automatically added as padding).
TP
We use the R method to calculate the take-profit price. By default, it’s set at 2. The EA measures the distance between the entry and stop-loss price and simply multiplies it with the number you choose.
Trailing Stop
An automatic trailing stop feature is not built-in into the EA, but a good practice is to trail along with the Parabolic SAR dots as the trade progresses in your favor.
Recommended Timeframe
For the most part, I trade on the H4. It’s a nice spot between H1(day trading) and D1 (swing trading). The chart moves slow enough for me to strategize and there is definitely less noise (false signals) compared to the H1.
Interested in knowing about Divergence Trading? Click here.
How The SAR Indicator Was Invented?
According to the information I found in this article investopedia.com, it explains the introduction to Parabolic SAR (Stop and Reverse) in technical analysis. Parabolic SAR is an indicator developed by J. Welles Wilder Jr. and is used to identify market trends and provide accurate entry and exit points. Parabolic SAR uses dots that represent stop and reverse levels on the price chart. These dots assist traders in recognizing trend changes and provide signals to exit or enter the market. If the Parabolic SAR dots are below the current price, it indicates an uptrend, while if the dots are above the current price, it indicates a downtrend.
The article also discusses how Parabolic SAR can be used in trading strategies, including its use as a stop-loss and trailing stop point. This indicator helps traders protect their profits and reduce the risk of losses by adjusting the stop-loss level according to price movements.
Source: Investopedia.com
The downward trend depicted in the chart offers profitable opportunities for traders. By using this indicator, traders can maintain the appropriate selling position (or exit from buying positions) until a pullback occurs. Even when the downtrend continues, this indicator provides clear signals and allows traders to confidently re-enter the market. By leveraging this indicator, traders can optimize their profits and make strategic moves in their trades.
Additionally, the article explains insights into the use of Parabolic SAR in identifying trend reversals and the formation of new trends. Traders can use this indicator to confirm trading signals and make better decisions.
Overall, the article provides a clear explanation of the usage and benefits of Parabolic SAR in technical analysis. Traders can leverage this indicator to identify trends, determine optimal entry and exit points, and manage risks in their trades.
Trading A Parabolic SAR Strategy – Download The EA
Full disclaimer: Use it at your own risk. If you wish to download the EA, it’s available at no cost. EAs have helped me tremendously with the execution aspect of trading. It lets me walk away from my chart and takes a position even when I’m sleeping.
It still doesn’t replace the human, as I’m still doing my top-down analysis, finding direction bias, and looking for high probability entries, I’m merely letting the EA pull the trigger. In the long run, it’s always good practice to make good trades by risking small, not overtrading, and ensuring that your wins are bigger than your losses. ( learn more about forex trading strategies )
If you’ve never used an EA before, I’d recommend that you subscribe to a VPN service, so that it can work fully without being disrupted by your computer’s performance or bad internet connection.